
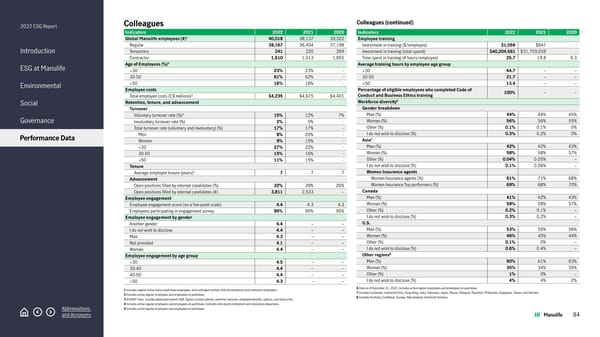
2022 ESG Report Introduction ESG at Manulife Environmental Social Governance Performance Data Abbreviations and Acronyms Colleagues Indicators 2022 2021 2020 Global Manulife employees (#) 1 40,018 38,137 39,322 Regular 38,167 36,404 37,198 Temporary 241 220 269 Contractor 1,610 1,513 1,855 Age of Employees (%) 2 <30 23% 23% - 30-50 61% 62% - >50 16% 16% - Employee costs Total employee costs (C$ millions) 3 $4,235 $4,675 $4,401 Retention, tenure, and advancement Turnover Voluntary turnover rate (%) 4 15% 12% 7% Involuntary turnover rate (%) 2% 5% - Total turnover rate (voluntary and involuntary) (%) 17% 17% - Men 8% 20% - Women 9% 15% - <30 27% 22% - 30-50 15% 16% - >50 11% 15% - Tenure Average employee tenure (years) 5 7 7 7 Advancement Open positions filled by internal candidates (%) 32% 39% 26% Open positions filled by internal candidates (#) 3,811 2,533 – Employee engagement Employee engagement score (on a five-point scale) 4.4 4.3 4.3 Employees participating in engagement survey 95% 95% 95% Employee engagement by gender Another gender 4.4 – – I do not wish to disclose 4.4 – – Man 4.3 – – Not provided 4.1 – – Woman 4.4 – – Employee engagement by age group <30 4.5 – – 30-40 4.4 – – 40-50 4.4 – – >50 4.3 – – 1 Includes regular active and on paid leave employees, and contingent workers that are temporary and contractor employees. 2 Includes active regular employees and employees on paid leave. 3 At GAAP rates. Includes global permanent staff. Figures include salaries, overtime, bonuses, employee benefits, options, and share units. 4 Includes active regular employees and employees on paid leave. Excludes exits due to retirement and involuntary departures. 5 Includes active regular employees and employees on paid leave. Colleagues (continued) Indicators 2022 2021 2020 Employee training Investment in training ($/employee) $1,059 $847 - Investment in training (total spend) $40,204,661 $31,759,058 - Time spent in training (# hours/employee) 25.7 19.8 9.3 Average training hours by employee age group <30 44.7 – – 30-50 21.7 – – >50 13.4 – – Percentage of eligible employees who completed Code of Conduct and Business Ethics training 100% – – Workforce diversity 6 Gender breakdown Man (%) 44% 44% 45% Woman (%) 56% 56% 55% Other (%) 0.1% 0.1% 0% I do not wish to disclose (%) 0.3% 0.2% 0% Asia 7 Man (%) 42% 42% 43% Woman (%) 58% 58% 57% Other (%) 0.04% 0.05% – I do not wish to disclose (%) 0.1% 0.06% – Women Insurance agents Women Insurance agents (%) 61% 71% 68% Women Insurance Top performers (%) 69% 68% 70% Canada Man (%) 41% 42% 43% Woman (%) 59% 58% 57% Other (%) 0.2% 0.1% – I do not wish to disclose (%) 0.3% 0.2% – U.S. Man (%) 53% 55% 56% Woman (%) 46% 45% 44% Other (%) 0.1% 0% – I do not wish to disclose (%) 0.6% 0.4% – Other regions 8 Man (%) 60% 61% 63% Woman (%) 35% 34% 35% Other (%) 1% 0% – I do not wish to disclose (%) 4% 4% 2% 6 Data as of December 31, 2022. Includes active regular employees and employees on paid leave. 7 Includes Cambodia, mainland China, Hong Kong, India, Indonesia, Japan, Macau, Malaysia, Myanmar, Philippines, Singapore, Taiwan, and Vietnam. 8 Includes Australia, Caribbean, Europe, New Zealand, and South America. 84
 2022 Manulife ESG Report Page 83 Page 85