
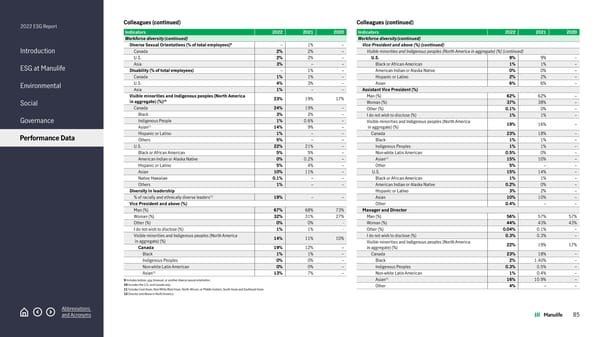
2022 ESG Report Introduction ESG at Manulife Environmental Social Governance Performance Data Abbreviations and Acronyms Colleagues (continued) Indicators 2022 2021 2020 Workforce diversity (continued) Diverse Sexual Orientations (% of total employees) 9 – 1% – Canada 2% 2% – U.S. 2% 2% – Asia 3% – – Disability (% of total employees) – 1% – Canada 1% 1% – U.S. 4% 3% – Asia 1% – – Visible minorities and Indigenous peoples (North America in aggregate) (%) 10 23% 19% 17% Canada 24% 19% – Black 3% 2% – Indigenous People 1% 0.6% – Asian 11 14% 9% – Hispanic or Latino 1% – – Others 5% – – U.S. 22% 21% – Black or African American 5% 5% – American Indian or Alaska Native 0% 0.2% – Hispanic or Latino 5% 4% – Asian 10% 11% – Native Hawaiian 0.1% – – Others 1% – – Diversity in leadership % of racially and ethnically diverse leaders 12 19% – – Vice President and above (%) Man (%) 67% 68% 73% Woman (%) 32% 31% 27% Other (%) 0% 0% - I do not wish to disclose (%) 1% 1% - Visible minorities and Indigenous peoples (North America in aggregate) (%) 14% 11% 10% Canada 19% 12% – Black 1% 1% – Indigenous Peoples 0% 0% – Non-white Latin American 0% 0% – Asian 11 13% 7% – 9 Includes lesbian, gay, bisexual, or another diverse sexual orientation. 10 Includes the U.S. and Canada only. 11 Includes East Asian; Non-White West Asian, North African, or Middle Eastern; South Asian and Southeast Asian 12 Director and Above in North America. Colleagues (continued) Indicators 2022 2021 2020 Workforce diversity (continued) Vice President and above (%) (continued) Visible minorities and Indigenous peoples (North America in aggregate) (%) (continued) U.S. 9% 9% – Black or African American 1% 1% – American Indian or Alaska Native 0% 0% – Hispanic or Latino 2% 2% – Asian 6% 6% – Assistant Vice President (%) Man (%) 62% 62% – Woman (%) 37% 38% – Other (%) 0.1% 0% – I do not wish to disclose (%) 1% 1% – Visible minorities and Indigenous peoples (North America in aggregate) (%) 19% 16% – Canada 23% 18% – Black 1% 1% – Indigenous Peoples 1% 1% – Non-white Latin American 0.5% 0% – Asian 11 15% 10% – Other 5% – – U.S. 15% 14% – Black or African American 1% 1% – American Indian or Alaska Native 0.2% 0% – Hispanic or Latino 3% 2% – Asian 10% 10% – Other 0.4% – – Manager and Director Man (%) 56% 57% 57% Woman (%) 44% 43% 43% Other (%) 0.04% 0.1% – I do not wish to disclose (%) 0.3% 0.3% – Visible minorities and Indigenous peoples (North America in aggregate) (%) 22% 19% 17% Canada 23% 18% – Black 2% 1.40% – Indigenous Peoples 0.3% 0.5% – Non-white Latin American 1% 0.4% – Asian 11 16% 10.9% – Other 4% – – 85
 2022 Manulife ESG Report Page 84 Page 86