
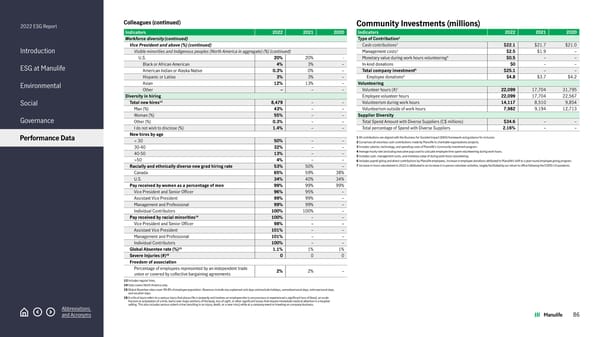
2022 ESG Report Introduction ESG at Manulife Environmental Social Governance Performance Data Abbreviations and Acronyms Colleagues (continued) Indicators 2022 2021 2020 Workforce diversity (continued) Vice President and above (%) (continued) Visible minorities and Indigenous peoples (North America in aggregate) (%) (continued) U.S. 20% 20% - Black or African American 4% 3% – American Indian or Alaska Native 0.3% 0% – Hispanic or Latino 3% 3% – Asian 12% 13% – Other – – – Diversity in hiring Total new hires 13 8,479 – – Man (%) 43% – – Woman (%) 55% – – Other (%) 0.3% – – I do not wish to disclose (%) 1.4% – – New hires by age < 30 50% – – 30-40 32% – – 40-50 13% – – >50 4% – – Racially and ethnically diverse new grad hiring rate 53% 50% – Canada 65% 59% 38% U.S. 34% 40% 34% Pay received by women as a percentage of men 99% 99% 99% Vice President and Senior Officer 96% 95% – Assistant Vice President 99% 99% – Management and Professional 99% 99% – Individual Contributors 100% 100% – Pay received by racial minorities 14 100% – – Vice President and Senior Officer 98% – – Assistant Vice President 101% – – Management and Professional 101% – – Individual Contributors 100% – – Global Absentee rate (%) 15 1.1% 1% 1% Severe Injuries (#) 16 0 0 0 Freedom of association Percentage of employees represented by an independent trade union or covered by collective bargaining agreements 2% 2% – 13 Includes regular hires. 14 Data covers North America only. 15 Global Absentee rates cover 99.8% of employee population. Absences include any unplanned sick days and exclude holidays, earned personal days, extra personal days, and vacation days. 16 A critical injury refers to a serious injury that places life in jeopardy and involves an employee who is unconscious or experienced a significant loss of blood, an acute fracture or amputation of a limb, burns over major portions of the body, loss of sight, or other significant losses that require immediate medical attention in a hospital setting. This also includes serious violent crime (resulting in an injury, death, or a near miss) while at a company event or traveling on company business. Community Investments (millions) Indicators 2022 2021 2020 Type of Contribution 1 Cash contributions 2 $22.1 $21.7 $21.0 Management costs 3 $2.5 $1.9 – Monetary value during work hours volunteering 4 $0.5 – – In-kind donations $0 – – Total company investment 5 $25.1 – – Employee donations 6 $4.8 $3.7 $4.2 Volunteering Volunteer hours (#) 7 22,099 17,704 31,795 Employee volunteer hours 22,099 17,704 22,567 Volunteerism during work hours 14,117 8,510 9,854 Volunteerism outside of work hours 7,982 9,194 12,713 Supplier Diversity Total Spend Amount with Diverse Suppliers (C$ millions) $34.6 – – Total percentage of Spend with Diverse Suppliers 2.16% – – 1 All contributions are aligned with the Business for Societal Impact (B4SI) framework and guidance for inclusion. 2 Comprises all voluntary cash contributions made by Manulife to charitable organizations/projects. 3 Includes salaries, technology, and operating costs of Manulife's Community Investment program. 4 Average hourly rate (excluding executive pay) used to calcuate employee time spent volunteeering during work hours. 5 Includes cash, management costs, and monetary value of during work hours volunteering. 6 Includes payroll giving and direct contributions by Manulife employees. Increase in employee donations attributed to Manulife’s shift to a year-round employee giving program. 7 Increase in hours volunteered in 2022 is attributed to an increase in in-person volunteer activities, largely facilitated by our return to office following the COVID-19 pandemic. 86
 2022 Manulife ESG Report Page 85 Page 87