
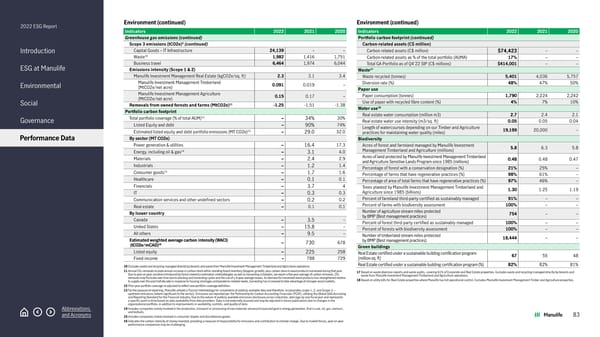
2022 ESG Report Introduction ESG at Manulife Environmental Social Governance Performance Data Abbreviations and Acronyms Environment (continued) Indicators 2022 2021 2020 Greenhouse gas emissions (continued) Scope 3 emissions (tCO2e) 5 (continued) Capital Goods – IT Infrastructure 24,139 – – Waste 10 1,982 1,416 1,751 Business travel 6,464 1,974 6,044 Emissions intensity (Scope 1 & 2) Manulife Investment Management Real Estate (kgCO2e/sq. ft) 2.3 3.1 3.4 Manulife Investment Management Timberland (MtCO2e/net acre) 0.091 0.019 – Manulife Investment Management Agriculture (MtCO2e/net acre) 0.15 0.17 – Removals from owned forests and farms (MtCO2e) 11 -1.25 -1.51 -1.38 Portfolio carbon footprint Total portfolio coverage (% of total AUM) 12 – 34% 30% Listed Equity and debt – 90% 74% Estimated listed equity and debt portfolio emissions (MT CO2e) 13 – 29.0 32.0 By sector (MT CO2e) Power generation & utilities – 16.4 17.3 Energy, including oil & gas 14 – 3.1 4.0 Materials – 2.4 2.9 Industrials – 1.2 1.4 Consumer goods 15 – 1.7 1.6 Healthcare – 0.1 0.1 Financials – 3.7 4 IT – 0.3 0.3 Communication services and other undefined sectors – 0.2 0.2 Real estate – 0.1 0.1 By Issuer country Canada – 3.5 – United States – 15.8 – All others – 9.5 – Estimated weighted average carbon intensity (WACI) (tCO2e/mCAD) 16 – 730 678 Listed equity – 225 258 Fixed income – 788 729 10 Excludes waste and recycling managed directly by tenants and waste from Manulife Investment Management Timberland and Agriculture operations. 11 Annual CO 2 removals include annual increase in carbon stock within standing forest inventory (biogenic growth), plus carbon store in wood products harvested during that year. Due to year-on-year variation introduced by forest inventory estimation methodologies as well as harvesting schedules, we report a five-year average of carbon removals. CO 2 removals may fluctuate over time due to planting and harvesting cycles and the use of a 5-year average moves. As demand for harvested wood products has strengthened relative to supply over the past half-decade in response to housing shortages and pandemic-related needs, harvesting has increased to take advantage of stronger wood markets. 12 Prior year portfolio coverage re-adjusted to reflect new portfolio coverage definition. 13 For the purpose of reporting, Manulife utilized a Trucost methodology for compilation of publicly available data and therefore, incorporates scope 1, 2, and Scope 3 –- upstream emissions (where significant to the sector). Emissions are reported per the Partnership for Carbon Accounting Financials (PCAF), utilizing the Global GHG Accouting and Reporting Standard for the Financial Industry. Due to the nature of publicly available emissions disclosure across industries, data lags by one fiscal year and represents a specific point-in-time based on data availability from data providers. Data is not externally assured and may be adjusted in future publications due to changes in the organizational portfolio, in addition to improvements in availability, controls, and quality of data. 14 Includes companies mainly involved in the production, transport or processing of raw materials whose principal end goal is energy generation, that is coal, oil, gas, uranium, and biofuels. 15 Includes companies mainly involved in consumer staples and discretionary goods. 16 Indicates the carbon intensity of money invested, providing a measure of responsibility for emissions and contribution to climate change. Due to market forces, year-on-year performance comparison may be challenging. Environment (continued) Indicators 2022 2021 2020 Portfolio carbon footprint (continued) Carbon-related assets (C$ million) Carbon related assets (C$ million) $74,423 – – Carbon-related assets as % of the total portfolio (AUMA) 17% – – Total GA Portfolio as of Q4'22 SIP (C$ millions) $414,001 – – Waste 17 Waste recycled (tonnes) 5,401 4,036 5,757 Diversion rate (%) 48% 47% 50% Paper use Paper consumption (tonnes) 1,790 2,224 2,242 Use of paper with recycled fibre content (%) 4% 7% 10% Water use 18 Real estate water consumption (million m3) 2.7 2.4 2.1 Real estate water use intensity (m3/sq. ft) 0.05 0.05 0.04 Length of watercourses depending on our Timber and Agriculture practices for maintaining water quality (miles) 19,199 20,000 – Biodiversity Acres of forest and farmland managed by Manulife Investment Management Timberland and Agriculture (millions) 5.8 6.3 5.8 Acres of land protected by Manulife Investment Management Timberland and Agriculture Sensitive Lands Program since 1985 (millions) 0.48 0.48 0.47 Percentage of forest with a conservation designation (%) 21% 25% – Percentage of farms that have regenerative practices (%) 98% 61% – Percentage of area of total farms that have regenerative practices (%) 97% 46% – Trees planted by Manulife Investment Management Timberland and Agriculture since 1985 (billions) 1.30 1.25 1.19 Percent of farmland third-party certified as sustainably managed 91% – – Percent of farms with biodiversity assessment 100% – – Number of agriculture stream miles protected by BMP (Best management practices) 754 – – Percent of forest third-party certified as sustainably managed 100% – – Percent of forests with biodiversity assessment 100% – – Number of timberland stream miles protected by BMP (Best management practices) 18,444 – – Green buildings Real Estate certified under a sustainable building certification program (million sq. ft) 67 55 48 Real Estate certified under a sustainable building certification program (%) 82% 82% 81% 17 Based on waste diversion reports and waste audits, covering 61% of Corporate and Real Estate properties. Excludes waste and recycling managed directly by tenants and waste from Manulife Investment Management Timberland and Agriculture operations. 18 Based on utility bills for Real Estate properties where Manulife has full operational control. Excludes Manlulife Investment Management Timber and Agriculture properties. 83
 2022 Manulife ESG Report Page 82 Page 84