
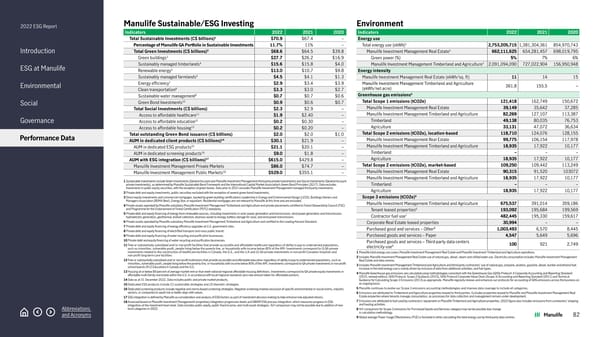
2022 ESG Report Introduction ESG at Manulife Environmental Social Governance Performance Data Abbreviations and Acronyms Manulife Sustainable/ESG Investing Indicators 2022 2021 2020 Total Sustainable Investments (C$ billions) 1 $70.9 $67.4 – Percentage of Manulife GA Portfolio in Sustainable Investments 11.7% 11% – Total Green Investments (C$ billions) 2 $68.6 $64.5 $39.8 Green buildings 3 $27.7 $26.2 $16.9 Sustainably managed timberlands 4 $15.6 $15.8 $4.0 Renewable energy 5 $13.0 $10.7 $9.8 Sustainably managed farmlands 6 $4.5 $4.1 $1.3 Energy efficiency 7 $2.9 $3.4 $3.9 Clean transportation 8 $3.3 $3.0 $2.7 Sustainable water management 9 $0.7 $0.7 $0.6 Green Bond Investments 10 $0.9 $0.6 $0.7 Total Social Investments (C$ billions) $2.3 $2.9 – Access to affordable healthcare 11 $1.9 $2.40 – Access to affordable education 12 $0.2 $0.30 – Access to affordable housing 13 $0.2 $0.20 – Total outstanding Green Bond issuance (C$ billions) $2.0 $2.0 $1.0 AUM in dedicated client products (C$ billions) 14 $30.1 $21.9 – AUM in dedicated ESG products 15 $21.1 $20.1 – AUM in dedicated screening products 16 $9.0 $1.8 – AUM with ESG integration (C$ billions) 17 $615.0 $429.8 – Manulife Investment Management Private Markets $86.0 $74.7 – Manulife Investment Management Public Markets 18 $529.0 $355.1 – 1 Sustainable investments include Green Investments (General Account and Manulife Investment Management third-party private investments) and Social investments (General Account private investments), as determined by Manulife Sustainable Bond Framework and the International Capital Market Association’s Green Bond Principles (2017). Data excludes investments in public equity securities, with the exception of green bonds. Data prior to 2021 excludes Manulife Investment Management managed third-party investments. 2 Private debt and equity investments, public securities excluded with the exception of several green bond investments. 3 Direct equity investments and commercial mortgages, backed by green building certifications Leadership in Energy and Environmental Design (LEED), Buildings Owners and Managers Association (BOMA Best), Energy Star, or equivilant. Residential mortgages are not relevant to Manulife at this time and are excluded. 4 Private assets operated by Manulife subsidiary Manulife Investment Management Timberland and Agriculture and private placements certified to Forest Stewardship Council (FSC) and Programme for the Endorsement of Forest Certification (PEFC) standards. 5 Private debt and equity financing of energy from renewable sources, including investments in solar power generation and transmission, wind power generation and transmission, hydroelectric generation, geothermal, biofuel collection, biomass waste to energy, battery storage for solar, and wind power transmission. 6 Private assets operated by Manulife subsidiary Manulife Investment Management Timberland and Agriculture and certified to the Leading Harvest Standard. 7 Private debt and equity financing of energy efficiency upgrades at U.S. government sites. 8 Private debt and equity financing of electrified transport and mass public transit. 9 Private debt and equity financing of water recycling and purification businesses. 10 Private debt and equity financing of water recycling and purification businesses. 11 Free or substantially subsidized and/or non-profit facilities that provide accessible and affordable healthcare regardless of ability to pay to underserved populations, such as minorities, vulnerable youth, people living below the poverty line, or households with income below 80% of the AMI. Investments correspond to (i) GA private investments related to the construction of healthcare facilities in Canada, the U.S., and the U.K and (ii) GA private investments in non-profit Canadian hospitals and non-profit long-term-care facilities. 12 Free or substantially subsidized and/or non-profit institutions that provide accessible and affordable education regardless of ability to pay to underserved populations, such as minorities, vulnerable youth, people living below the poverty line, or households with income below 80% of the AMI. Investments correspond to GA private investments in non-profit school boards (K12 Education) in Canada and the U.S. 13 Housing at or below 80 percent of average market rent or that meet national/regional affordable housing definitions. Investments correspond to GA private equity investments in affordable multi-family real estate within the U.S. in accordance with local/regional standards (pro-rate amount taken for affordable portion). 14 Data as at 31 December 2022. Data includes public and private market products. 15 Dedicated ESG products include (1) sustainable strategies and (2) thematic strategies. 16 Dedicated screening products include negative and norms-based screening strategies. Negative screening involves exclusion of specific environmental or social norms, industry sectors, or companies to avoid risk or better align with values. 17 ESG integration is defined by Manulife as consideration and analysis of ESG factors as part of investment decision-making to help enhance risk-adjusted returns. 18 Assessed based on Manulife Investment Management’s proprietary integration progression levels and GWAM ESG process integration, which measures progress in ESG integration at the investment team level. Data includes public equity, public fixed income, and multi-asset strategies. YoY comparison may not be possible due to addition of new fund categories in 2022. Environment Indicators 2022 2021 2020 Energy use Total energy use (ekWh) 1 2,753,205,715 1,381,304,361 854,970,743 Manulife Investment Management Real Estate 2 662,111,625 654,281,457 698,019,795 Green power (%) 5% 7% 6% Manulife Investment Management Timberland and Agriculture 3 2,091,094,090 727,022,904 156,950,948 Energy intensity Manulife Investment Management Real Estate (ekWh/sq. ft) 11 14 15 Manulife Investment Management Timberland and Agriculture (ekWh/net acre) 361.8 155.5 – Greenhouse gas emissions 4 Total Scope 1 emissions (tCO2e) 121,418 162,749 150,672 Manulife Investment Management Real Estate 39,149 35,642 37,285 Manulife Investment Management Timberland and Agriculture 82,269 127,107 113,387 Timberland 49,138 80,035 76,753 Agriculture 33,131 47,072 36,634 Total Scope 2 emissions (tCO2e), location-based 118,710 124,076 128,155 Manulife Investment Management Real Estate 99,775 106,154 117,978 Manulife Investment Management Timberland and Agriculture 18,935 17,922 10,177 Timberland – – – Agriculture 18,935 17,922 10,177 Total Scope 2 emissions (tCO2e), market-based 109,250 109,442 113,249 Manulife Investment Management Real Estate 90,315 91,520 103072 Manulife Investment Management Timberland and Agriculture 18,935 17,922 10,177 Timberland – – – Agriculture 18,935 17,922 10,177 Scope 3 emissions (tCO2e) 5 Manulife Investment Management Timberland and Agriculture 675,537 391,014 359,186 Tenant leased properties 6 193,092 195,684 199,569 Contractor fuel use 7 482,445 195,330 159,617 Corporate Real Estate leased properties 30,994 – – Purchased good and services – Other 8 1,003,493 6,570 8,445 Purchased goods and services – Paper 4,547 5,649 5,696 Purchased goods and services – Third-party data centers electricity use 9 100 921 2,749 1 Manulife total energy use covers Manulife Investment Management Real Estate and Manulife Investment Timberland and Agriculture operations. 2 Includes Manulife Investment Management Real Estate use of natural gas, diesel, steam and chilled water use. Electricity consumption includes Manulife Investment Management Real Estate and data centres. 3 Includes Manulife Investment Management Timberland and Agriculture and third-party contractors' use of natural gas, propane, aviation, gasoline, diesel, bunker and ethanol fuel. Increase in the total energy use is mainly driven by inclusion of data from additional activities, and fuel types. 4 Manulife Greenhouse gas emissions are calculated using methodologies consistent with the Greenhouse Gas (GHG) Protocol: A Corporate Accounting and Reporting Standard (2015, revised edition), GHG Protocol: Scope 2 Guidance (2015), GHG Protocol Corporate Value Chain (Scope 3) Accounting and Reporting Standard (2011) and Technical Guidance for Calculating Scope 3 Emissions (2013) as appropriate. Manulife regularly reviews and enhances our protocols for accounting of GHG emissions across the business on an ongoing basis. 5 Manulife continues to evolve our Scope 3 emissions accounting methodologies and improve data coverage to include all categories. 6 Emissions are attributed to Timberland and Agriculture properties leased to third-parties. Excludes properties leased to Manulife and Manulife Investment Management Real Estate properties where tenants manage consumption, as processes for data collection and management remain under development. 7 Emissions are attributed to fuel used by contractors’ equipment on Manulife Timberland and Agriculture properties. 2022 figure also includes emissions from contractors’ shipping and hauling activities. 8 YoY comparison for Scope 3 emissions for Purchased Goods and Services category may not be possible due change in calculation methodology. 9 Global average Power Usage Effectiveness (PUE) is factored in while calculating the total energy use by third-party data centres. 82
 2022 Manulife ESG Report Page 81 Page 83