
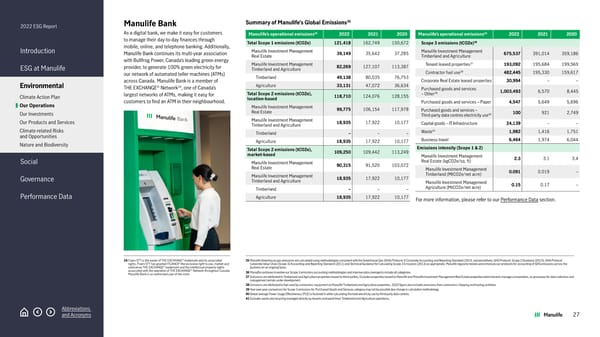
2022 ESG Report Introduction ESG at Manulife Environmental Climate Action Plan Our Operations Our Investments Our Products and Services Climate-related Risks and Opportunities Nature and Biodiversity Social Governance Performance Data Abbreviations and Acronyms Manulife Bank As a digital bank, we make it easy for customers to manage their day-to-day finances through mobile, online, and telephone banking. Additionally, Manulife Bank continues its multi-year association with Bullfrog Power, Canada’s leading green energy provider, to generate 100% green electricity for our network of automated teller machines (ATMs) across Canada. Manulife Bank is a member of THE EXCHANGE ® Network 34 , one of Canada’s largest networks of ATMs, making it easy for customers to find an ATM in their neighbourhood. 34 Fiserv EFT is the owner of THE EXCHANGE ® trademark and its associated rights. Fiserv EFT has granted FICANEX ® the exclusive right to use, market and sublicense THE EXCHANGE ® trademark and the intellectual property rights associated with the operation of THE EXCHANGE ® Network throughout Canada. Manulife Bank is an authorized user of the mark. Summary of Manulife's Global Emissions 35 Manulife’s operational emissions 35 2022 2021 2020 Total Scope 1 emissions (tCO2e) 121,418 162,749 150,672 Manulife Investment Management Real Estate 39,149 35,642 37,285 Manulife Investment Management Timberland and Agriculture 82,269 127,107 113,387 Timberland 49,138 80,035 76,753 Agriculture 33,131 47,072 36,634 Total Scope 2 emissions (tCO2e), location-based 118,710 124,076 128,155 Manulife Investment Management Real Estate 99,775 106,154 117,978 Manulife Investment Manag ement Timberland and Agriculture 18,935 17,922 10,177 Timberland – – – Agriculture 18,935 17,922 10,177 Total Scope 2 emissions (tCO2e), market-based 109,250 109,442 113,249 Manulife Investment Management Real Estate 90,315 91,520 103,072 Manulife Investment Manag ement Timberland and Agriculture 18,935 17,922 10,177 Timberland – – – Agriculture 18,935 17,922 10,177 Manulife’s operational emissions 35 2022 2021 2020 Scope 3 emissions (tCO2e) 36 Manulife Investment Management Timberland and Agriculture 675,537 391,014 359,186 Tenant leased properties 37 193,092 195,684 199,569 Contractor fuel use 38 482,445 195,330 159,617 Corporate Real Estate leased properties 30,994 – – Purchased goods and services – Other 39 1,003,493 6,570 8,445 Purchased goods and services – Paper 4,547 5,649 5,696 Purchased goods and services – Third-party data centres electricity use 40 100 921 2,749 Capital goods – IT Infrastructure 24,139 – – Waste 41 1,982 1,416 1,751 Business travel 6,464 1,974 6,044 Emissions intensity (Scope 1 & 2) Manulife Investment Manag ement Real Estate (kgCO2e/sq. ft) 2.3 3.1 3.4 Manulife Investment Management Timberland (MtCO2e/net acre) 0.091 0.019 – Manulife Investment Management Agriculture (MtCO2e/net acre) 0.15 0.17 – For more information, please refer to our Performance Data section. 35 Manulife Greenhouse gas emissions are calculated using methodologies consistent with the Greenhouse Gas (GHG) Protocol: A Corporate Accounting and Reporting Standard (2015, revised edition), GHG Protocol: Scope 2 Guidance (2015), GHG Protocol Corporate Value Chain (Scope 3) Accounting and Reporting Standard (2011) and Technical Guidance for Calculating Scope 3 Emissions (2013) as appropriate. Manulife regularly reviews and enhances our protocols for accounting of GHG emissions across the business on an ongoing basis. 36 Manulife continues to evolve our Scope 3 emissions accounting metho dologies and improve data coverage to include all categories. 37 Emissions are attributed to Timberland and Agriculture properties leased to third-parties. Excludes properties leased to Manulife and Manulife Investment Management Real Estate properties where tenants manage consumption, as processes for data collection and management remain under development. 38 Emissions are attribute d to fuel used by contractors’ equipment on Manulife Timberland and Agriculture properties. 2022 figure also includes emissions from contractors’ shipping and hauling activities. 39 Year-over-year comparison for Scope 3 emissions for Purchased Goods and Services category may not be possible due change in calculation methodology. 40 Global average Power Usage Effectiveness (PUE) is factored in while calculating the total electricity use by third-party data centres. 41 Excludes waste and recycling managed directly by tenants and waste from Timberland and Agriculture operations. 27
 2022 Manulife ESG Report Page 26 Page 28