
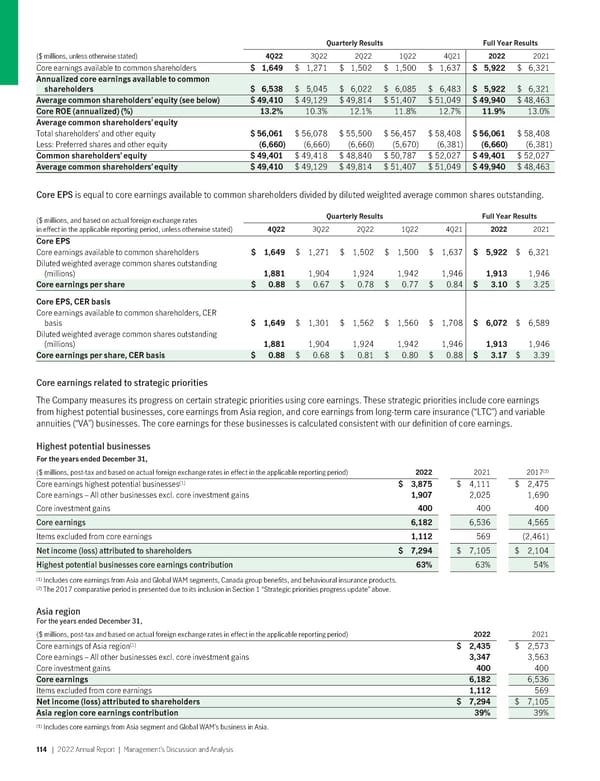
QuarterlyResults Full YearResults ($ millions, unless otherwise stated) 4Q22 3Q22 2Q22 1Q22 4Q21 2022 2021 Core earnings available to common shareholders $ 1,649 $ 1,271 $ 1,502 $ 1,500 $ 1,637 $ 5,922 $ 6,321 Annualizedcoreearningsavailabletocommon shareholders $ 6,538 $ 5,045 $ 6,022 $ 6,085 $ 6,483 $ 5,922 $ 6,321 Averagecommonshareholders’equity(seebelow) $49,410 $ 49,129 $ 49,814 $ 51,407 $ 51,049 $49,940 $ 48,463 CoreROE(annualized)(%) 13.2% 10.3% 12.1% 11.8% 12.7% 11.9% 13.0% Averagecommonshareholders’equity Total shareholders’ and other equity $56,061 $ 56,078 $ 55,500 $ 56,457 $ 58,408 $56,061 $ 58,408 Less: Preferred shares and other equity (6,660) (6,660) (6,660) (5,670) (6,381) (6,660) (6,381) Commonshareholders’equity $49,401 $ 49,418 $ 48,840 $ 50,787 $ 52,027 $49,401 $ 52,027 Averagecommonshareholders’equity $49,410 $ 49,129 $ 49,814 $ 51,407 $ 51,049 $49,940 $ 48,463 Core EPS is equal to core earnings available to common shareholders divided by diluted weighted average common shares outstanding. ($ millions, and based on actual foreign exchange rates QuarterlyResults Full YearResults in effect in the applicable reporting period, unless otherwise stated) 4Q22 3Q22 2Q22 1Q22 4Q21 2022 2021 CoreEPS Core earnings available to common shareholders $ 1,649 $ 1,271 $ 1,502 $ 1,500 $ 1,637 $ 5,922 $ 6,321 Diluted weighted average common shares outstanding (millions) 1,881 1,904 1,924 1,942 1,946 1,913 1,946 Coreearningspershare $ 0.88 $ 0.67 $ 0.78 $ 0.77 $ 0.84 $ 3.10 $ 3.25 CoreEPS,CERbasis Core earnings available to common shareholders, CER basis $ 1,649 $ 1,301 $ 1,562 $ 1,560 $ 1,708 $ 6,072 $ 6,589 Diluted weighted average common shares outstanding (millions) 1,881 1,904 1,924 1,942 1,946 1,913 1,946 Coreearningspershare,CERbasis $ 0.88 $ 0.68 $ 0.81 $ 0.80 $ 0.88 $ 3.17 $ 3.39 Core earnings related to strategic priorities The Company measures its progress on certain strategic priorities using core earnings. These strategic priorities include core earnings from highest potential businesses, core earnings from Asia region, and core earnings from long-term care insurance (“LTC”) and variable annuities (“VA”) businesses. The core earnings for these businesses is calculated consistent with our definition of core earnings. Highest potential businesses FortheyearsendedDecember31, ($ millions, post-tax and based on actual foreign exchange rates in effect in the applicable reporting period) 2022 2021 2017(2) (1) Core earnings highest potential businesses $ 3,875 $ 4,111 $ 2,475 Core earnings – All other businesses excl. core investment gains 1,907 2,025 1,690 Core investment gains 400 400 400 Core earnings 6,182 6,536 4,565 Items excluded from core earnings 1,112 569 (2,461) Net income (loss) attributed to shareholders $ 7,294 $ 7,105 $ 2,104 Highest potential businesses core earnings contribution 63% 63% 54% (1) Includes core earnings from Asia and Global WAM segments, Canada group benefits, and behavioural insurance products. (2) The 2017 comparative period is presented due to its inclusion in Section 1 “Strategic priorities progress update” above. Asia region For the years ended December 31, ($ millions, post-tax and based on actual foreign exchange rates in effect in the applicable reporting period) 2022 2021 (1) Core earnings of Asia region $ 2,435 $ 2,573 Core earnings – All other businesses excl. core investment gains 3,347 3,563 Core investment gains 400 400 Coreearnings 6,182 6,536 Items excluded from core earnings 1,112 569 Netincome(loss)attributedtoshareholders $ 7,294 $ 7,105 Asiaregioncoreearningscontribution 39% 39% (1) Includes core earnings from Asia segment and Global WAM’s business in Asia. 114 | 2022AnnualReport | Management’sDiscussionandAnalysis
 2022 Annual Report Page 115 Page 117