
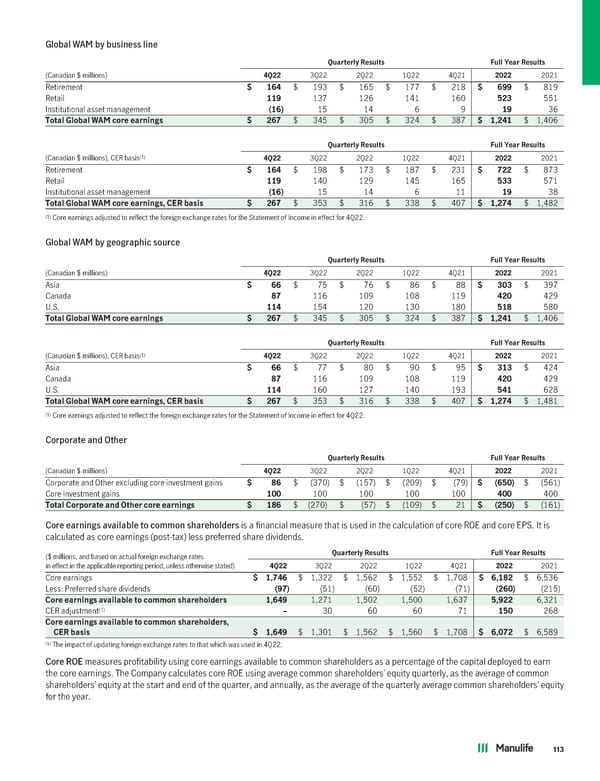
Global WAM by business line QuarterlyResults Full YearResults (Canadian $ millions) 4Q22 3Q22 2Q22 1Q22 4Q21 2022 2021 Retirement $ 164 $ 193 $ 165 $ 177 $ 218 $ 699 $ 819 Retail 119 137 126 141 160 523 551 Institutional asset management (16) 15 14 6 9 19 36 TotalGlobalWAMcoreearnings $ 267 $ 345 $ 305 $ 324 $ 387 $ 1,241 $ 1,406 QuarterlyResults Full YearResults (1) (Canadian $ millions), CER basis 4Q22 3Q22 2Q22 1Q22 4Q21 2022 2021 Retirement $ 164 $ 198 $ 173 $ 187 $ 231 $ 722 $ 873 Retail 119 140 129 145 165 533 571 Institutional asset management (16) 15 14 6 11 19 38 TotalGlobalWAMcoreearnings,CERbasis $ 267 $ 353 $ 316 $ 338 $ 407 $ 1,274 $ 1,482 (1) Core earnings adjusted to reflect the foreign exchange rates for the Statement of Income in effect for 4Q22. Global WAM by geographic source QuarterlyResults Full YearResults (Canadian $ millions) 4Q22 3Q22 2Q22 1Q22 4Q21 2022 2021 Asia $66$ 75 $ 76 $ 86 $ 88 $ 303 $ 397 Canada 87 116 109 108 119 420 429 U.S. 114 154 120 130 180 518 580 TotalGlobalWAMcoreearnings $ 267 $ 345 $ 305 $ 324 $ 387 $ 1,241 $ 1,406 QuarterlyResults Full YearResults (1) (Canadian $ millions), CER basis 4Q22 3Q22 2Q22 1Q22 4Q21 2022 2021 Asia $66$ 77 $ 80 $ 90 $ 95 $ 313 $ 424 Canada 87 116 109 108 119 420 429 U.S. 114 160 127 140 193 541 628 TotalGlobalWAMcoreearnings,CERbasis $ 267 $ 353 $ 316 $ 338 $ 407 $ 1,274 $ 1,481 (1) Core earnings adjusted to reflect the foreign exchange rates for the Statement of Income in effect for 4Q22. Corporate and Other QuarterlyResults Full YearResults (Canadian $ millions) 4Q22 3Q22 2Q22 1Q22 4Q21 2022 2021 Corporate and Other excluding core investment gains $86$ (370) $ (157) $ (209) $ (79) $ (650) $ (561) Core investment gains 100 100 100 100 100 400 400 TotalCorporateandOthercoreearnings $ 186 $ (270) $ (57) $ (109) $ 21 $ (250) $ (161) Core earnings available to common shareholders is a financial measure that is used in the calculation of core ROE and core EPS. It is calculated as core earnings (post-tax) less preferred share dividends. ($ millions, and based on actual foreign exchange rates QuarterlyResults Full YearResults in effect in the applicable reporting period, unless otherwise stated) 4Q22 3Q22 2Q22 1Q22 4Q21 2022 2021 Core earnings $ 1,746 $ 1,322 $ 1,562 $ 1,552 $ 1,708 $ 6,182 $ 6,536 Less: Preferred share dividends (97) (51) (60) (52) (71) (260) (215) Coreearningsavailabletocommonshareholders 1,649 1,271 1,502 1,500 1,637 5,922 6,321 (1) CER adjustment – 30 60 60 71 150 268 Coreearningsavailabletocommonshareholders, CERbasis $ 1,649 $ 1,301 $ 1,562 $ 1,560 $ 1,708 $ 6,072 $ 6,589 (1) The impact of updating foreign exchange rates to that which was used in 4Q22. Core ROE measures profitability using core earnings available to common shareholders as a percentage of the capital deployed to earn the core earnings. The Company calculates core ROE using average common shareholders’ equity quarterly, as the average of common shareholders’ equity at the start and end of the quarter, and annually, as the average of the quarterly average common shareholders’ equity for the year. 113
 2022 Annual Report Page 114 Page 116