
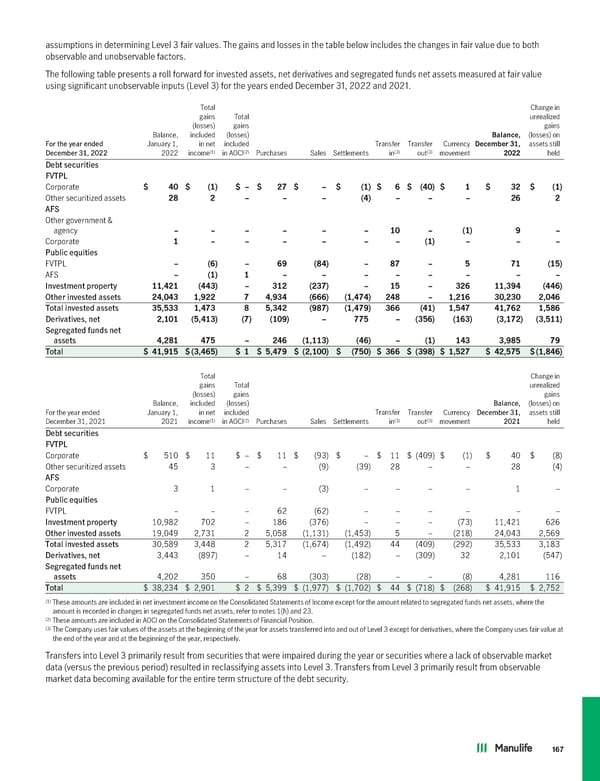
assumptions in determining Level 3 fair values. The gains and losses in the table below includes the changes in fair value due to both observable and unobservable factors. The following table presents a roll forward for invested assets, net derivatives and segregated funds net assets measured at fair value using significant unobservable inputs (Level 3) for the years ended December 31, 2022 and 2021. Total Change in gains Total unrealized (losses) gains gains Balance, included (losses) Balance, (losses) on For the year ended January 1, in net included Transfer Transfer Currency December31, assets still (1) (2) (3) (3) December 31, 2022 2022 income in AOCI Purchases Sales Settlements in out movement 2022 held Debt securities FVTPL Corporate $ 40 $ (1) $ – $ 27 $ – $ (1) $ 6 $ (40) $ 1 $ 32 $ (1) Other securitized assets 28 2 – – – (4) – – – 26 2 AFS Other government & agency ––––––10–(1)9– Corporate 1––––––(1)––– Public equities FVTPL – (6) – 69 (84) – 87 – 5 71 (15) AFS –(1)1–––––– –– Investment property 11,421 (443) – 312 (237) – 15 – 326 11,394 (446) Other invested assets 24,043 1,922 7 4,934 (666) (1,474) 248 – 1,216 30,230 2,046 Total invested assets 35,533 1,473 8 5,342 (987) (1,479) 366 (41) 1,547 41,762 1,586 Derivatives, net 2,101 (5,413) (7) (109) – 775 – (356) (163) (3,172) (3,511) Segregated funds net assets 4,281 475 – 246 (1,113) (46) – (1) 143 3,985 79 Total $ 41,915 $(3,465) $ 1 $ 5,479 $ (2,100) $ (750) $ 366 $ (398) $ 1,527 $ 42,575 $(1,846) Total Change in gains Total unrealized (losses) gains gains Balance, included (losses) Balance, (losses) on For the year ended January 1, in net included Transfer Transfer Currency December 31, assets still (1) (2) (3) (3) December 31, 2021 2021 income in AOCI Purchases Sales Settlements in out movement 2021 held Debt securities FVTPL Corporate $ 510 $ 11 $ – $ 11 $ (93) $ – $ 11 $ (409) $ (1) $ 40 $ (8) Other securitized assets 45 3 – – (9) (39) 28 – – 28 (4) AFS Corporate 3 1 – – (3) – – – – 1 – Public equities FVTPL – – – 62 (62) – – – – – – Investment property 10,982 702 – 186 (376) – – – (73) 11,421 626 Other invested assets 19,049 2,731 2 5,058 (1,131) (1,453) 5 – (218) 24,043 2,569 Total invested assets 30,589 3,448 2 5,317 (1,674) (1,492) 44 (409) (292) 35,533 3,183 Derivatives, net 3,443 (897) – 14 – (182) – (309) 32 2,101 (547) Segregated funds net assets 4,202 350 – 68 (303) (28) – – (8) 4,281 116 Total $ 38,234 $ 2,901 $ 2 $ 5,399 $ (1,977) $ (1,702) $ 44 $ (718) $ (268) $ 41,915 $ 2,752 (1) These amounts are included in net investment income on the Consolidated Statements of Income except for the amount related to segregated funds net assets, where the amount is recorded in changes in segregated funds net assets, refer to notes 1(h) and 23. (2) These amounts are included in AOCI on the Consolidated Statements of Financial Position. (3) The Company uses fair values of the assets at the beginning of the year for assets transferred into and out of Level 3 except for derivatives, where the Company uses fair value at the end of the year and at the beginning of the year, respectively. Transfers into Level 3 primarily result from securities that were impaired during the year or securities where a lack of observable market data (versus the previous period) resulted in reclassifying assets into Level 3. Transfers from Level 3 primarily result from observable market data becoming available for the entire term structure of the debt security. 167
 2022 Annual Report Page 168 Page 170