
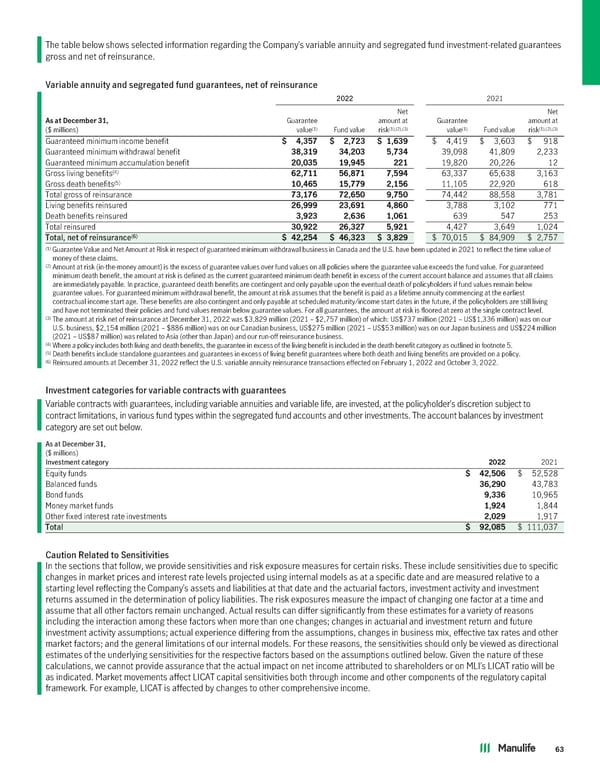
The table below shows selected information regarding the Company’s variable annuity and segregated fund investment-related guarantees gross and net of reinsurance. Variable annuity and segregated fund guarantees, net of reinsurance 2022 2021 Net Net AsatDecember31, Guarantee amount at Guarantee amount at (1) Fund value (1),(2),(3) (1) Fund value (1),(2),(3) ($ millions) value risk value risk Guaranteed minimum income benefit $ 4,357 $ 2,723 $ 1,639 $ 4,419 $ 3,603 $ 918 Guaranteed minimum withdrawal benefit 38,319 34,203 5,734 39,098 41,809 2,233 Guaranteed minimum accumulation benefit 20,035 19,945 221 19,820 20,226 12 (4) Gross living benefits 62,711 56,871 7,594 63,337 65,638 3,163 (5) Gross death benefits 10,465 15,779 2,156 11,105 22,920 618 Total gross of reinsurance 73,176 72,650 9,750 74,442 88,558 3,781 Living benefits reinsured 26,999 23,691 4,860 3,788 3,102 771 Death benefits reinsured 3,923 2,636 1,061 639 547 253 Total reinsured 30,922 26,327 5,921 4,427 3,649 1,024 Total, net of reinsurance(6) $ 42,254 $ 46,323 $ 3,829 $ 70,015 $ 84,909 $ 2,757 (1) Guarantee Value and Net Amount at Risk in respect of guaranteed minimum withdrawal business in Canada and the U.S. have been updated in 2021 to reflect the time value of money of these claims. (2) Amount at risk (in-the-money amount) is the excess of guarantee values over fund values on all policies where the guarantee value exceeds the fund value. For guaranteed minimum death benefit, the amount at risk is defined as the current guaranteed minimum death benefit in excess of the current account balance and assumes that all claims are immediately payable. In practice, guaranteed death benefits are contingent and only payable upon the eventual death of policyholders if fund values remain below guarantee values. For guaranteed minimum withdrawal benefit, the amount at risk assumes that the benefit is paid as a lifetime annuity commencing at the earliest contractual income start age. These benefits are also contingent and only payable at scheduled maturity/income start dates in the future, if the policyholders are still living and have not terminated their policies and fund values remain below guarantee values. For all guarantees, the amount at risk is floored at zero at the single contract level. (3) The amount at risk net of reinsurance at December 31, 2022 was $3,829 million (2021 – $2,757 million) of which: US$737 million (2021 – US$1,336 million) was on our U.S. business, $2,154 million (2021 – $886 million) was on our Canadian business, US$275 million (2021 – US$53 million) was on our Japan business and US$224 million (2021 – US$87 million) was related to Asia (other than Japan) and our run-off reinsurance business. (4) Where a policy includes both living and death benefits, the guarantee in excess of the living benefit is included in the death benefit category as outlined in footnote 5. (5) Death benefits include standalone guarantees and guarantees in excess of living benefit guarantees where both death and living benefits are provided on a policy. (6) Reinsured amounts at December 31, 2022 reflect the U.S. variable annuity reinsurance transactions effected on February 1, 2022 and October 3, 2022. Investment categories for variable contracts with guarantees Variable contracts with guarantees, including variable annuities and variable life, are invested, at the policyholder’s discretion subject to contract limitations, in various fund types within the segregated fund accounts and other investments. The account balances by investment category are set out below. As at December 31, ($ millions) Investment category 2022 2021 Equity funds $ 42,506 $ 52,528 Balanced funds 36,290 43,783 Bond funds 9,336 10,965 Money market funds 1,924 1,844 Other fixed interest rate investments 2,029 1,917 Total $ 92,085 $ 111,037 Caution Related to Sensitivities In the sections that follow, we provide sensitivities and risk exposure measures for certain risks. These include sensitivities due to specific changes in market prices and interest rate levels projected using internal models as at a specific date and are measured relative to a starting level reflecting the Company’s assets and liabilities at that date and the actuarial factors, investment activity and investment returns assumed in the determination of policy liabilities. The risk exposures measure the impact of changing one factor at a time and assume that all other factors remain unchanged. Actual results can differ significantly from these estimates for a variety of reasons including the interaction among these factors when more than one changes; changes in actuarial and investment return and future investment activity assumptions; actual experience differing from the assumptions, changes in business mix, effective tax rates and other market factors; and the general limitations of our internal models. For these reasons, the sensitivities should only be viewed as directional estimates of the underlying sensitivities for the respective factors based on the assumptions outlined below. Given the nature of these calculations, we cannot provide assurance that the actual impact on net income attributed to shareholders or on MLI’s LICAT ratio will be as indicated. Market movements affect LICAT capital sensitivities both through income and other components of the regulatory capital framework. For example, LICAT is affected by changes to other comprehensive income. 63
 2022 Annual Report Page 64 Page 66