
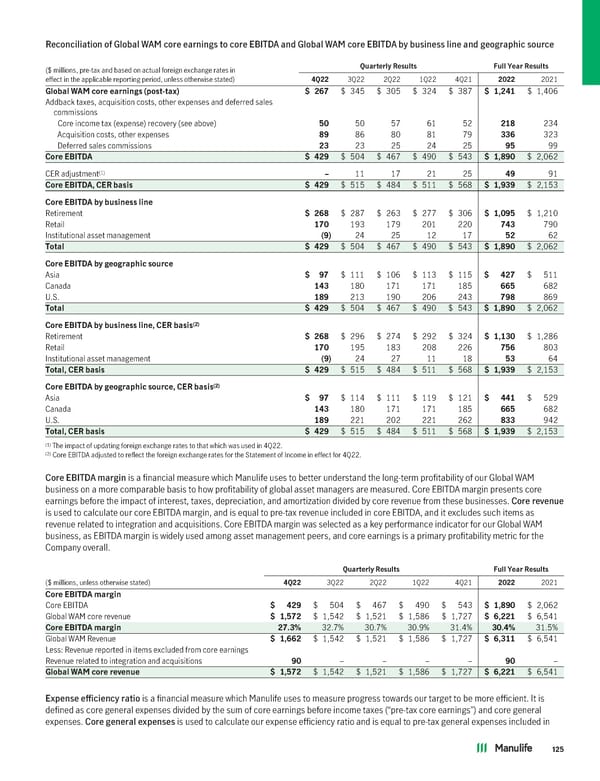
Reconciliation of Global WAM core earnings to core EBITDA and Global WAM core EBITDA by business line and geographic source ($ millions, pre-tax and based on actual foreign exchange rates in QuarterlyResults Full YearResults effect in the applicable reporting period, unless otherwise stated) 4Q22 3Q22 2Q22 1Q22 4Q21 2022 2021 GlobalWAMcoreearnings(post-tax) $ 267 $ 345 $ 305 $ 324 $ 387 $ 1,241 $ 1,406 Addback taxes, acquisition costs, other expenses and deferred sales commissions Core income tax (expense) recovery (see above) 50 50 57 61 52 218 234 Acquisition costs, other expenses 89 86 80 81 79 336 323 Deferred sales commissions 23 23 25 24 25 95 99 CoreEBITDA $ 429 $ 504 $ 467 $ 490 $ 543 $ 1,890 $ 2,062 (1) CER adjustment – 11 17 21 25 49 91 CoreEBITDA,CERbasis $ 429 $ 515 $ 484 $ 511 $ 568 $ 1,939 $ 2,153 CoreEBITDAbybusinessline Retirement $ 268 $ 287 $ 263 $ 277 $ 306 $ 1,095 $ 1,210 Retail 170 193 179 201 220 743 790 Institutional asset management (9) 24 25 12 17 52 62 Total $ 429 $ 504 $ 467 $ 490 $ 543 $ 1,890 $ 2,062 CoreEBITDAbygeographicsource Asia $97$111 $ 106 $ 113 $ 115 $ 427 $ 511 Canada 143 180 171 171 185 665 682 U.S. 189 213 190 206 243 798 869 Total $ 429 $ 504 $ 467 $ 490 $ 543 $ 1,890 $ 2,062 CoreEBITDAbybusinessline,CERbasis(2) Retirement $ 268 $ 296 $ 274 $ 292 $ 324 $ 1,130 $ 1,286 Retail 170 195 183 208 226 756 803 Institutional asset management (9) 24 27 11 18 53 64 Total, CERbasis $ 429 $ 515 $ 484 $ 511 $ 568 $ 1,939 $ 2,153 (2) CoreEBITDAbygeographicsource,CERbasis Asia $97$114 $ 111 $ 119 $ 121 $ 441 $ 529 Canada 143 180 171 171 185 665 682 U.S. 189 221 202 221 262 833 942 Total, CERbasis $ 429 $ 515 $ 484 $ 511 $ 568 $ 1,939 $ 2,153 (1) The impact of updating foreign exchange rates to that which was used in 4Q22. (2) Core EBITDA adjusted to reflect the foreign exchange rates for the Statement of Income in effect for 4Q22. Core EBITDA margin is a financial measure which Manulife uses to better understand the long-term profitability of our Global WAM business on a more comparable basis to how profitability of global asset managers are measured. Core EBITDA margin presents core earnings before the impact of interest, taxes, depreciation, and amortization divided by core revenue from these businesses. Core revenue is used to calculate our core EBITDA margin, and is equal to pre-tax revenue included in core EBITDA, and it excludes such items as revenue related to integration and acquisitions. Core EBITDA margin was selected as a key performance indicator for our Global WAM business, as EBITDA margin is widely used among asset management peers, and core earnings is a primary profitability metric for the Company overall. QuarterlyResults Full YearResults ($ millions, unless otherwise stated) 4Q22 3Q22 2Q22 1Q22 4Q21 2022 2021 CoreEBITDAmargin Core EBITDA $ 429 $ 504 $ 467 $ 490 $ 543 $ 1,890 $ 2,062 Global WAM core revenue $ 1,572 $ 1,542 $ 1,521 $ 1,586 $ 1,727 $ 6,221 $ 6,541 CoreEBITDAmargin 27.3% 32.7% 30.7% 30.9% 31.4% 30.4% 31.5% Global WAM Revenue $ 1,662 $ 1,542 $ 1,521 $ 1,586 $ 1,727 $ 6,311 $ 6,541 Less: Revenue reported in items excluded from core earnings Revenue related to integration and acquisitions 90 – – – – 90 – GlobalWAMcorerevenue $ 1,572 $ 1,542 $ 1,521 $ 1,586 $ 1,727 $ 6,221 $ 6,541 Expense efficiency ratio is a financial measure which Manulife uses to measure progress towards our target to be more efficient. It is defined as core general expenses divided by the sum of core earnings before income taxes (“pre-tax core earnings”) and core general expenses. Core general expenses is used to calculate our expense efficiency ratio and is equal to pre-tax general expenses included in 125
 2022 Annual Report Page 126 Page 128