
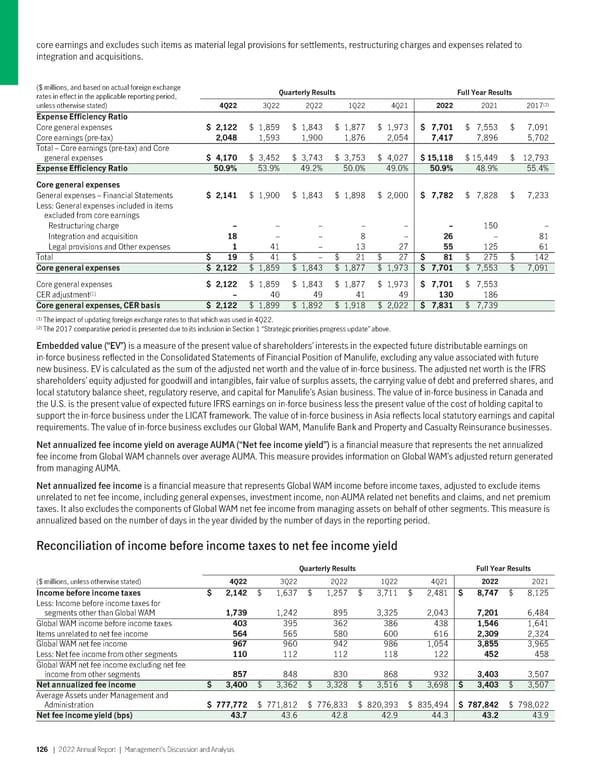
core earnings and excludes such items as material legal provisions for settlements, restructuring charges and expenses related to integration and acquisitions. ($ millions, and based on actual foreign exchange QuarterlyResults Full YearResults rates in effect in the applicable reporting period, unless otherwise stated) 4Q22 3Q22 2Q22 1Q22 4Q21 2022 2021 2017(2) ExpenseEfficiencyRatio Core general expenses $ 2,122 $ 1,859 $ 1,843 $ 1,877 $ 1,973 $ 7,701 $ 7,553 $ 7,091 Core earnings (pre-tax) 2,048 1,593 1,900 1,876 2,054 7,417 7,896 5,702 Total – Core earnings (pre-tax) and Core general expenses $ 4,170 $ 3,452 $ 3,743 $ 3,753 $ 4,027 $15,118 $ 15,449 $ 12,793 ExpenseEfficiencyRatio 50.9% 53.9% 49.2% 50.0% 49.0% 50.9% 48.9% 55.4% Coregeneralexpenses General expenses – Financial Statements $ 2,141 $ 1,900 $ 1,843 $ 1,898 $ 2,000 $ 7,782 $ 7,828 $ 7,233 Less: General expenses included in items excluded from core earnings Restructuring charge – – – – – – 150 – Integration and acquisition 18 – – 8 – 26 – 81 Legal provisions and Other expenses 1 41 – 13 27 55 125 61 Total $19$ 41 $ – $ 21 $ 27 $81$ 275 $ 142 Coregeneralexpenses $ 2,122 $ 1,859 $ 1,843 $ 1,877 $ 1,973 $ 7,701 $ 7,553 $ 7,091 Core general expenses $ 2,122 $ 1,859 $ 1,843 $ 1,877 $ 1,973 $ 7,701 $ 7,553 (1) CER adjustment – 40 49 41 49 130 186 Coregeneralexpenses,CERbasis $ 2,122 $ 1,899 $ 1,892 $ 1,918 $ 2,022 $ 7,831 $ 7,739 (1) The impact of updating foreign exchange rates to that which was used in 4Q22. (2) The 2017 comparative period is presented due to its inclusion in Section 1 “Strategic priorities progress update” above. Embedded value (“EV”) is a measure of the present value of shareholders’ interests in the expected future distributable earnings on in-force business reflected in the Consolidated Statements of Financial Position of Manulife, excluding any value associated with future new business. EV is calculated as the sum of the adjusted net worth and the value of in-force business. The adjusted net worth is the IFRS shareholders’ equity adjusted for goodwill and intangibles, fair value of surplus assets, the carrying value of debt and preferred shares, and local statutory balance sheet, regulatory reserve, and capital for Manulife’s Asian business. The value of in-force business in Canada and the U.S. is the present value of expected future IFRS earnings on in-force business less the present value of the cost of holding capital to support the in-force business under the LICAT framework. The value of in-force business in Asia reflects local statutory earnings and capital requirements. The value of in-force business excludes our Global WAM, Manulife Bank and Property and Casualty Reinsurance businesses. Net annualized fee income yield on average AUMA (“Net fee income yield”) is a financial measure that represents the net annualized fee income from Global WAM channels over average AUMA. This measure provides information on Global WAM’s adjusted return generated from managing AUMA. Net annualized fee income is a financial measure that represents Global WAM income before income taxes, adjusted to exclude items unrelated to net fee income, including general expenses, investment income, non-AUMA related net benefits and claims, and net premium taxes. It also excludes the components of Global WAM net fee income from managing assets on behalf of other segments. This measure is annualized based on the number of days in the year divided by the number of days in the reporting period. Reconciliation of income before income taxes to net fee income yield QuarterlyResults Full YearResults ($ millions, unless otherwise stated) 4Q22 3Q22 2Q22 1Q22 4Q21 2022 2021 Incomebeforeincometaxes $ 2,142 $ 1,637 $ 1,257 $ 3,711 $ 2,481 $ 8,747 $ 8,125 Less: Income before income taxes for segments other than Global WAM 1,739 1,242 895 3,325 2,043 7,201 6,484 Global WAM income before income taxes 403 395 362 386 438 1,546 1,641 Items unrelated to net fee income 564 565 580 600 616 2,309 2,324 Global WAM net fee income 967 960 942 986 1,054 3,855 3,965 Less: Net fee income from other segments 110 112 112 118 122 452 458 Global WAM net fee income excluding net fee income from other segments 857 848 830 868 932 3,403 3,507 Netannualizedfeeincome $ 3,400 $ 3,362 $ 3,328 $ 3,516 $ 3,698 $ 3,403 $ 3,507 Average Assets under Management and Administration $ 777,772 $ 771,812 $ 776,833 $ 820,393 $ 835,494 $ 787,842 $ 798,022 Netfeeincomeyield(bps) 43.7 43.6 42.8 42.9 44.3 43.2 43.9 126 | 2022AnnualReport | Management’sDiscussionandAnalysis
 2022 Annual Report Page 127 Page 129