
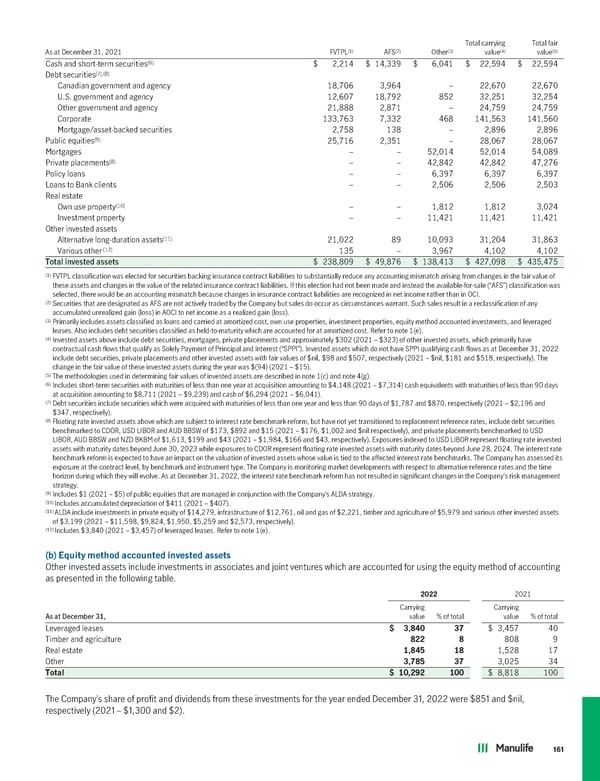
Total carrying Total fair (1) (2) (3) (4) (5) As at December 31, 2021 FVTPL AFS Other value value (6) Cash and short-term securities $ 2,214 $ 14,339 $ 6,041 $ 22,594 $ 22,594 (7),(8) Debt securities Canadian government and agency 18,706 3,964 – 22,670 22,670 U.S. government and agency 12,607 18,792 852 32,251 32,254 Other government and agency 21,888 2,871 – 24,759 24,759 Corporate 133,763 7,332 468 141,563 141,560 Mortgage/asset-backed securities 2,758 138 – 2,896 2,896 (9) Public equities 25,716 2,351 – 28,067 28,067 Mortgages – – 52,014 52,014 54,089 (8) Private placements – – 42,842 42,842 47,276 Policy loans – – 6,397 6,397 6,397 Loans to Bank clients – – 2,506 2,506 2,503 Real estate (10) Own use property – – 1,812 1,812 3,024 Investment property – – 11,421 11,421 11,421 Other invested assets (11) Alternative long-duration assets 21,022 89 10,093 31,204 31,863 (12) Various other 135 – 3,967 4,102 4,102 Total invested assets $ 238,809 $ 49,876 $ 138,413 $ 427,098 $ 435,475 (1) FVTPL classification was elected for securities backing insurance contract liabilities to substantially reduce any accounting mismatch arising from changes in the fair value of these assets and changes in the value of the related insurance contract liabilities. If this election had not been made and instead the available-for-sale (“AFS”) classification was selected, there would be an accounting mismatch because changes in insurance contract liabilities are recognized in net income rather than in OCI. (2) Securities that are designated as AFS are not actively traded by the Company but sales do occur as circumstances warrant. Such sales result in a reclassification of any accumulated unrealized gain (loss) in AOCI to net income as a realized gain (loss). (3) Primarily includes assets classified as loans and carried at amortized cost, own use properties, investment properties, equity method accounted investments, and leveraged leases. Also includes debt securities classified as held-to-maturity which are accounted for at amortized cost. Refer to note 1(e). (4) Invested assets above include debt securities, mortgages, private placements and approximately $302 (2021 – $323) of other invested assets, which primarily have contractual cash flows that qualify as Solely Payment of Principal and Interest (“SPPI”). Invested assets which do not have SPPI qualifying cash flows as at December 31, 2022 include debt securities, private placements and other invested assets with fair values of $nil, $98 and $507, respectively (2021 – $nil, $181 and $518, respectively). The change in the fair value of these invested assets during the year was $(94) (2021 – $15). (5) The methodologies used in determining fair values of invested assets are described in note 1(c) and note 4(g). (6) Includes short-term securities with maturities of less than one year at acquisition amounting to $4,148 (2021 – $7,314) cash equivalents with maturities of less than 90 days at acquisition amounting to $8,711 (2021 – $9,239) and cash of $6,294 (2021 – $6,041). (7) Debt securities include securities which were acquired with maturities of less than one year and less than 90 days of $1,787 and $870, respectively (2021 – $2,196 and $347, respectively). (8) Floating rate invested assets above which are subject to interest rate benchmark reform, but have not yet transitioned to replacement reference rates, include debt securities benchmarked to CDOR, USD LIBOR and AUD BBSW of $173, $892 and $15 (2021 – $176, $1,002 and $nil respectively), and private placements benchmarked to USD LIBOR, AUD BBSW and NZD BKBM of $1,613, $199 and $43 (2021 – $1,984, $166 and $43, respectively). Exposures indexed to USD LIBOR represent floating rate invested assets with maturity dates beyond June 30, 2023 while exposures to CDOR represent floating rate invested assets with maturity dates beyond June 28, 2024. The interest rate benchmark reform is expected to have an impact on the valuation of invested assets whose value is tied to the affected interest rate benchmarks. The Company has assessed its exposure at the contract level, by benchmark and instrument type. The Company is monitoring market developments with respect to alternative reference rates and the time horizon during which they will evolve. As at December 31, 2022, the interest rate benchmark reform has not resulted in significant changes in the Company’s risk management strategy. (9) Includes $1 (2021 – $5) of public equities that are managed in conjunction with the Company’s ALDA strategy. (10)Includes accumulated depreciation of $411 (2021 – $407). (11)ALDA include investments in private equity of $14,279, infrastructure of $12,761, oil and gas of $2,221, timber and agriculture of $5,979 and various other invested assets of $3,199 (2021 – $11,598, $9,824, $1,950, $5,259 and $2,573, respectively). (12)Includes $3,840 (2021 – $3,457) of leveraged leases. Refer to note 1(e). (b) Equitymethodaccountedinvestedassets Other invested assets include investments in associates and joint ventures which are accounted for using the equity method of accounting as presented in the following table. 2022 2021 Carrying Carrying As at December 31, value % of total value % of total Leveraged leases $ 3,840 37 $ 3,457 40 Timber and agriculture 822 8 808 9 Real estate 1,845 18 1,528 17 Other 3,785 37 3,025 34 Total $ 10,292 100 $ 8,818 100 The Company’s share of profit and dividends from these investments for the year ended December 31, 2022 were $851 and $nil, respectively (2021 – $1,300 and $2). 161
 2022 Annual Report Page 162 Page 164