
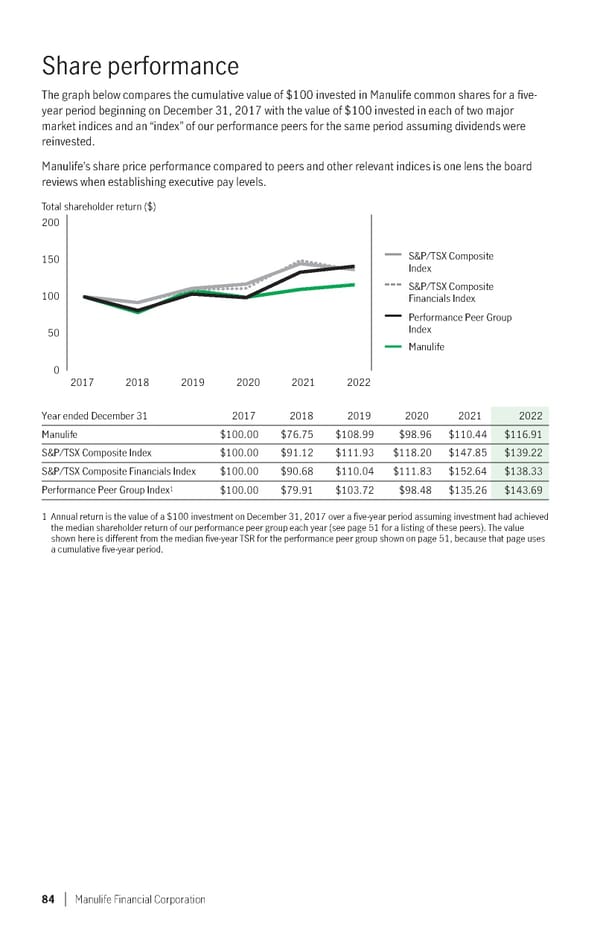
Share performance The graph below compares the cumulative value of $100 invested in Manulife common shares for a five- year period beginning on December 31, 2017 with the value of $100 invested in each of two major market indices and an “index” of our performance peers for the same period assuming dividends were reinvested. Manulife’s share price performance compared to peers and other relevant indices is one lens the board reviews when establishing executive pay levels. Total shareholder return ($) 200 150 — S&P/TSX Composite --- Index S&P/TSX Composite 100 Financials Index — Performance Peer Group 50 Index — Manulife 0 2017 2018 2019 2020 2021 2022 Year ended December 31 2017 2018 2019 2020 2021 2022 Manulife $100.00 $76.75 $108.99 $98.96 $110.44 $116.91 S&P/TSX Composite Index $100.00 $91.12 $111.93 $118.20 $147.85 $139.22 S&P/TSX Composite Financials Index $100.00 $90.68 $110.04 $111.83 $152.64 $138.33 1 Performance Peer Group Index $100.00 $79.91 $103.72 $98.48 $135.26 $143.69 1 Annual return is the value of a $100 investment on December 31, 2017 over a five-year period assuming investment had achieved the median shareholder return of our performance peer group each year (see page 51 for a listing of these peers). The value shown here is different from the median five-year TSR for the performance peer group shown on page 51, because that page uses a cumulative five-year period. 84 Manulife Financial Corporation
 2023 Management Information Circular Page 85 Page 87