
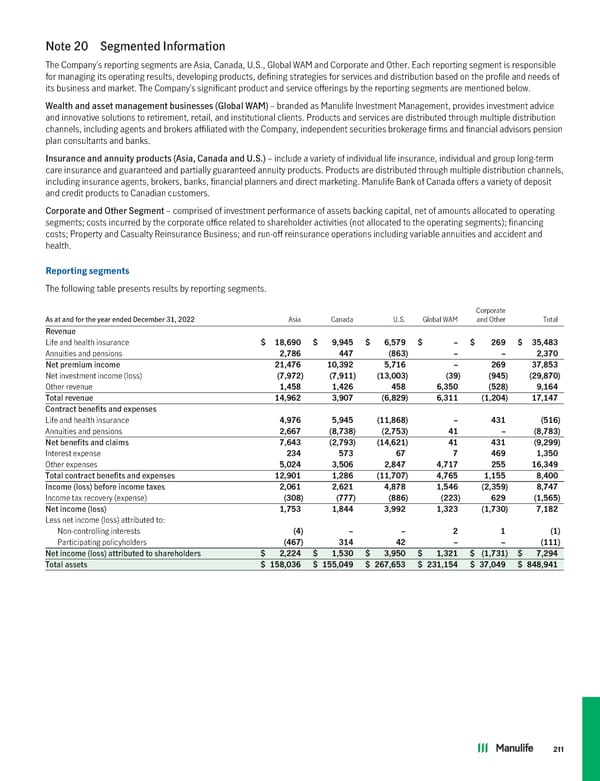
Note 20 Segmented Information The Company’s reporting segments are Asia, Canada, U.S., Global WAM and Corporate and Other. Each reporting segment is responsible for managing its operating results, developing products, defining strategies for services and distribution based on the profile and needs of its business and market. The Company’s significant product and service offerings by the reporting segments are mentioned below. Wealth and asset management businesses (Global WAM) – branded as Manulife Investment Management, provides investment advice and innovative solutions to retirement, retail, and institutional clients. Products and services are distributed through multiple distribution channels, including agents and brokers affiliated with the Company, independent securities brokerage firms and financial advisors pension plan consultants and banks. Insurance and annuity products (Asia, Canada and U.S.) – include a variety of individual life insurance, individual and group long-term care insurance and guaranteed and partially guaranteed annuity products. Products are distributed through multiple distribution channels, including insurance agents, brokers, banks, financial planners and direct marketing. Manulife Bank of Canada offers a variety of deposit and credit products to Canadian customers. Corporate and Other Segment – comprised of investment performance of assets backing capital, net of amounts allocated to operating segments; costs incurred by the corporate office related to shareholder activities (not allocated to the operating segments); financing costs; Property and Casualty Reinsurance Business; and run-off reinsurance operations including variable annuities and accident and health. Reportingsegments The following table presents results by reporting segments. Corporate As at and for the year ended December 31, 2022 Asia Canada U.S. Global WAM and Other Total Revenue Life and health insurance $ 18,690 $ 9,945 $ 6,579 $ – $ 269 $ 35,483 Annuities and pensions 2,786 447 (863) – – 2,370 Net premium income 21,476 10,392 5,716 – 269 37,853 Net investment income (loss) (7,972) (7,911) (13,003) (39) (945) (29,870) Other revenue 1,458 1,426 458 6,350 (528) 9,164 Total revenue 14,962 3,907 (6,829) 6,311 (1,204) 17,147 Contract benefits and expenses Life and health insurance 4,976 5,945 (11,868) – 431 (516) Annuities and pensions 2,667 (8,738) (2,753) 41 – (8,783) Net benefits and claims 7,643 (2,793) (14,621) 41 431 (9,299) Interest expense 234 573 67 7 469 1,350 Other expenses 5,024 3,506 2,847 4,717 255 16,349 Total contract benefits and expenses 12,901 1,286 (11,707) 4,765 1,155 8,400 Income (loss) before income taxes 2,061 2,621 4,878 1,546 (2,359) 8,747 Income tax recovery (expense) (308) (777) (886) (223) 629 (1,565) Net income (loss) 1,753 1,844 3,992 1,323 (1,730) 7,182 Less net income (loss) attributed to: Non-controlling interests (4) – – 2 1 (1) Participating policyholders (467) 314 42 – – (111) Net income (loss) attributed to shareholders $ 2,224 $ 1,530 $ 3,950 $ 1,321 $ (1,731) $ 7,294 Total assets $ 158,036 $ 155,049 $ 267,653 $ 231,154 $ 37,049 $ 848,941 211
 2022 Annual Report Page 212 Page 214