
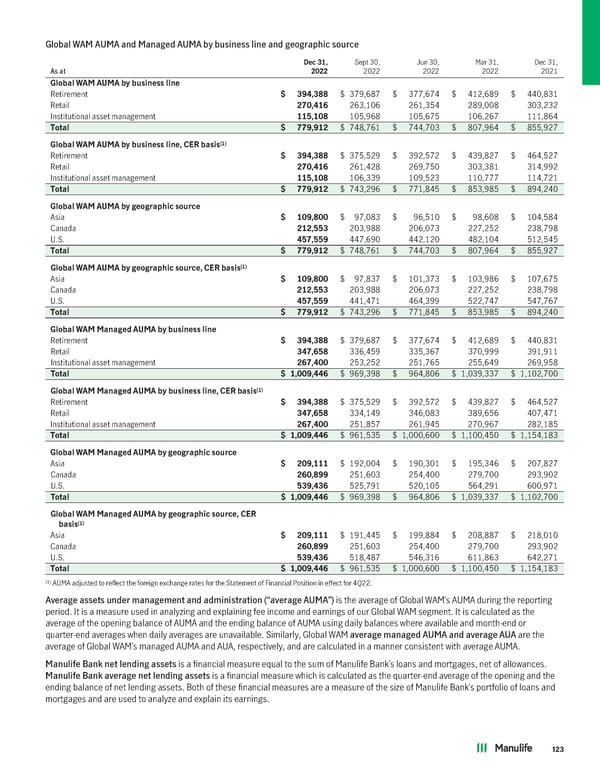
Global WAM AUMA and Managed AUMA by business line and geographic source Dec31, Sept 30, Jun 30, Mar 31, Dec 31, As at 2022 2022 2022 2022 2021 GlobalWAMAUMAbybusinessline Retirement $ 394,388 $ 379,687 $ 377,674 $ 412,689 $ 440,831 Retail 270,416 263,106 261,354 289,008 303,232 Institutional asset management 115,108 105,968 105,675 106,267 111,864 Total $ 779,912 $ 748,761 $ 744,703 $ 807,964 $ 855,927 (1) GlobalWAMAUMAbybusinessline,CERbasis Retirement $ 394,388 $ 375,529 $ 392,572 $ 439,827 $ 464,527 Retail 270,416 261,428 269,750 303,381 314,992 Institutional asset management 115,108 106,339 109,523 110,777 114,721 Total $ 779,912 $ 743,296 $ 771,845 $ 853,985 $ 894,240 GlobalWAMAUMAbygeographicsource Asia $ 109,800 $ 97,083 $ 96,510 $ 98,608 $ 104,584 Canada 212,553 203,988 206,073 227,252 238,798 U.S. 457,559 447,690 442,120 482,104 512,545 Total $ 779,912 $ 748,761 $ 744,703 $ 807,964 $ 855,927 (1) GlobalWAMAUMAbygeographicsource,CERbasis Asia $ 109,800 $ 97,837 $ 101,373 $ 103,986 $ 107,675 Canada 212,553 203,988 206,073 227,252 238,798 U.S. 457,559 441,471 464,399 522,747 547,767 Total $ 779,912 $ 743,296 $ 771,845 $ 853,985 $ 894,240 GlobalWAMManagedAUMAbybusinessline Retirement $ 394,388 $ 379,687 $ 377,674 $ 412,689 $ 440,831 Retail 347,658 336,459 335,367 370,999 391,911 Institutional asset management 267,400 253,252 251,765 255,649 269,958 Total $ 1,009,446 $ 969,398 $ 964,806 $ 1,039,337 $ 1,102,700 (1) GlobalWAMManagedAUMAbybusinessline,CERbasis Retirement $ 394,388 $ 375,529 $ 392,572 $ 439,827 $ 464,527 Retail 347,658 334,149 346,083 389,656 407,471 Institutional asset management 267,400 251,857 261,945 270,967 282,185 Total $ 1,009,446 $ 961,535 $ 1,000,600 $ 1,100,450 $ 1,154,183 GlobalWAMManagedAUMAbygeographicsource Asia $ 209,111 $ 192,004 $ 190,301 $ 195,346 $ 207,827 Canada 260,899 251,603 254,400 279,700 293,902 U.S. 539,436 525,791 520,105 564,291 600,971 Total $ 1,009,446 $ 969,398 $ 964,806 $ 1,039,337 $ 1,102,700 GlobalWAMManagedAUMAbygeographicsource,CER (1) basis Asia $ 209,111 $ 191,445 $ 199,884 $ 208,887 $ 218,010 Canada 260,899 251,603 254,400 279,700 293,902 U.S. 539,436 518,487 546,316 611,863 642,271 Total $ 1,009,446 $ 961,535 $ 1,000,600 $ 1,100,450 $ 1,154,183 (1) AUMA adjusted to reflect the foreign exchange rates for the Statement of Financial Position in effect for 4Q22. Average assets under management and administration (“average AUMA”) is the average of Global WAM’s AUMA during the reporting period. It is a measure used in analyzing and explaining fee income and earnings of our Global WAM segment. It is calculated as the average of the opening balance of AUMA and the ending balance of AUMA using daily balances where available and month-end or quarter-end averages when daily averages are unavailable. Similarly, Global WAM average managed AUMA and average AUA are the average of Global WAM’s managed AUMA and AUA, respectively, and are calculated in a manner consistent with average AUMA. Manulife Bank net lending assets is a financial measure equal to the sum of Manulife Bank’s loans and mortgages, net of allowances. Manulife Bank average net lending assets is a financial measure which is calculated as the quarter-end average of the opening and the ending balance of net lending assets. Both of these financial measures are a measure of the size of Manulife Bank’s portfolio of loans and mortgages and are used to analyze and explain its earnings. 123
 2022 Annual Report Page 124 Page 126