
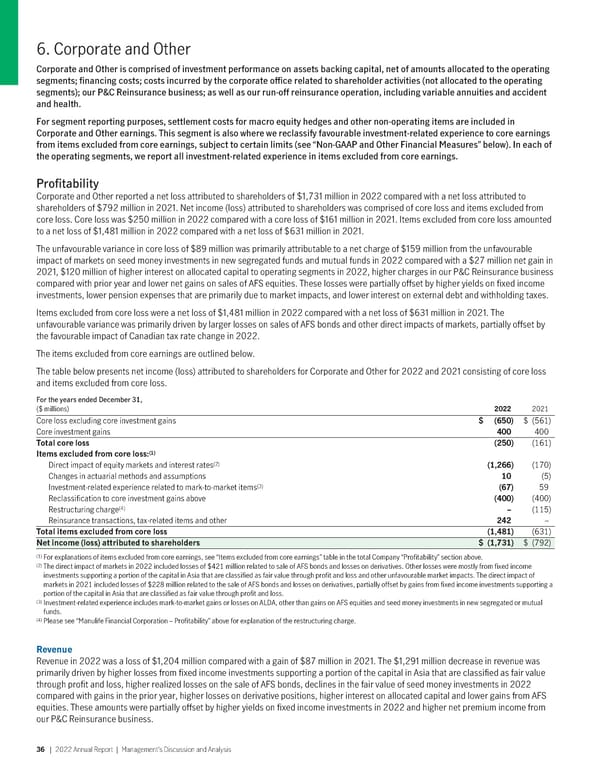
6. Corporate and Other Corporate and Other is comprised of investment performance on assets backing capital, net of amounts allocated to the operating segments; financing costs; costs incurred by the corporate office related to shareholder activities (not allocated to the operating segments); our P&C Reinsurance business; as well as our run-off reinsurance operation, including variable annuities and accident and health. For segment reporting purposes, settlement costs for macro equity hedges and other non-operating items are included in Corporate and Other earnings. This segment is also where we reclassify favourable investment-related experience to core earnings from items excluded from core earnings, subject to certain limits (see “Non-GAAP and Other Financial Measures” below). In each of the operating segments, we report all investment-related experience in items excluded from core earnings. Profitability Corporate and Other reported a net loss attributed to shareholders of $1,731 million in 2022 compared with a net loss attributed to shareholders of $792 million in 2021. Net income (loss) attributed to shareholders was comprised of core loss and items excluded from core loss. Core loss was $250 million in 2022 compared with a core loss of $161 million in 2021. Items excluded from core loss amounted to a net loss of $1,481 million in 2022 compared with a net loss of $631 million in 2021. The unfavourable variance in core loss of $89 million was primarily attributable to a net charge of $159 million from the unfavourable impact of markets on seed money investments in new segregated funds and mutual funds in 2022 compared with a $27 million net gain in 2021, $120 million of higher interest on allocated capital to operating segments in 2022, higher charges in our P&C Reinsurance business compared with prior year and lower net gains on sales of AFS equities. These losses were partially offset by higher yields on fixed income investments, lower pension expenses that are primarily due to market impacts, and lower interest on external debt and withholding taxes. Items excluded from core loss were a net loss of $1,481 million in 2022 compared with a net loss of $631 million in 2021. The unfavourable variance was primarily driven by larger losses on sales of AFS bonds and other direct impacts of markets, partially offset by the favourable impact of Canadian tax rate change in 2022. The items excluded from core earnings are outlined below. The table below presents net income (loss) attributed to shareholders for Corporate and Other for 2022 and 2021 consisting of core loss and items excluded from core loss. For the years ended December 31, ($ millions) 2022 2021 Core loss excluding core investment gains $ (650) $ (561) Core investment gains 400 400 Totalcoreloss (250) (161) (1) Itemsexcludedfromcoreloss: (2) Direct impact of equity markets and interest rates (1,266) (170) Changes in actuarial methods and assumptions 10 (5) (3) Investment-related experience related to mark-to-market items (67) 59 Reclassification to core investment gains above (400) (400) (4) Restructuring charge – (115) Reinsurance transactions, tax-related items and other 242 – Totalitemsexcludedfromcoreloss (1,481) (631) Netincome(loss)attributedtoshareholders $ (1,731) $ (792) (1) For explanations of items excluded from core earnings, see “Items excluded from core earnings” table in the total Company “Profitability” section above. (2) The direct impact of markets in 2022 included losses of $421 million related to sale of AFS bonds and losses on derivatives. Other losses were mostly from fixed income investments supporting a portion of the capital in Asia that are classified as fair value through profit and loss and other unfavourable market impacts. The direct impact of markets in 2021 included losses of $228 million related to the sale of AFS bonds and losses on derivatives, partially offset by gains from fixed income investments supporting a portion of the capital in Asia that are classified as fair value through profit and loss. (3) Investment-related experience includes mark-to-market gains or losses on ALDA, other than gains on AFS equities and seed money investments in new segregated or mutual funds. (4) Please see “Manulife Financial Corporation – Profitability” above for explanation of the restructuring charge. Revenue Revenue in 2022 was a loss of $1,204 million compared with a gain of $87 million in 2021. The $1,291 million decrease in revenue was primarily driven by higher losses from fixed income investments supporting a portion of the capital in Asia that are classified as fair value through profit and loss, higher realized losses on the sale of AFS bonds, declines in the fair value of seed money investments in 2022 compared with gains in the prior year, higher losses on derivative positions, higher interest on allocated capital and lower gains from AFS equities. These amounts were partially offset by higher yields on fixed income investments in 2022 and higher net premium income from our P&C Reinsurance business. 36 | 2022AnnualReport | Management’sDiscussionandAnalysis
 2022 Annual Report Page 37 Page 39