
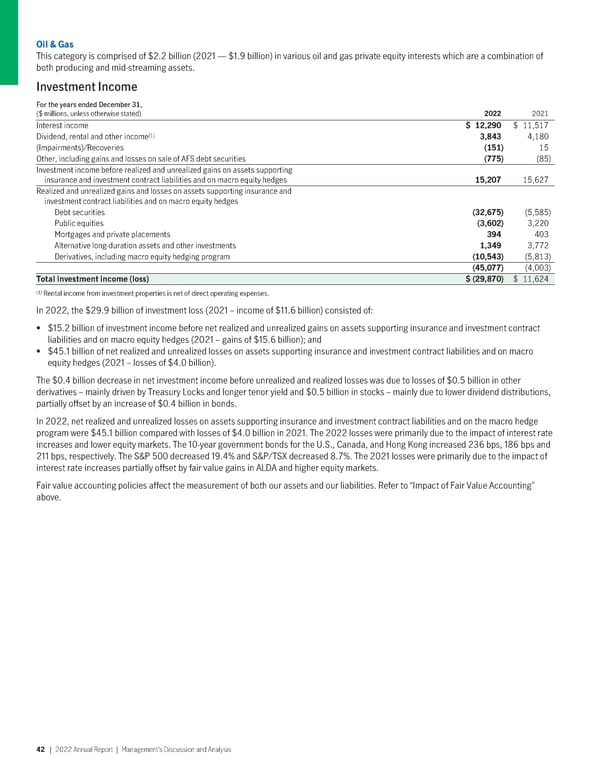
Oil & Gas This category is comprised of $2.2 billion (2021 — $1.9 billion) in various oil and gas private equity interests which are a combination of both producing and mid-streaming assets. Investment Income For the years ended December 31, ($ millions, unless otherwise stated) 2022 2021 Interest income $ 12,290 $ 11,517 (1) Dividend, rental and other income 3,843 4,180 (Impairments)/Recoveries (151) 15 Other, including gains and losses on sale of AFS debt securities (775) (85) Investment income before realized and unrealized gains on assets supporting insurance and investment contract liabilities and on macro equity hedges 15,207 15,627 Realized and unrealized gains and losses on assets supporting insurance and investment contract liabilities and on macro equity hedges Debt securities (32,675) (5,585) Public equities (3,602) 3,220 Mortgages and private placements 394 403 Alternative long-duration assets and other investments 1,349 3,772 Derivatives, including macro equity hedging program (10,543) (5,813) (45,077) (4,003) Totalinvestmentincome(loss) $(29,870) $ 11,624 (1) Rental income from investment properties is net of direct operating expenses. In 2022, the $29.9 billion of investment loss (2021 – income of $11.6 billion) consisted of: • $15.2 billion of investment income before net realized and unrealized gains on assets supporting insurance and investment contract liabilities and on macro equity hedges (2021 – gains of $15.6 billion); and • $45.1 billion of net realized and unrealized losses on assets supporting insurance and investment contract liabilities and on macro equity hedges (2021 – losses of $4.0 billion). The $0.4 billion decrease in net investment income before unrealized and realized losses was due to losses of $0.5 billion in other derivatives – mainly driven by Treasury Locks and longer tenor yield and $0.5 billion in stocks – mainly due to lower dividend distributions, partially offset by an increase of $0.4 billion in bonds. In 2022, net realized and unrealized losses on assets supporting insurance and investment contract liabilities and on the macro hedge program were $45.1 billion compared with losses of $4.0 billion in 2021. The 2022 losses were primarily due to the impact of interest rate increases and lower equity markets. The 10-year government bonds for the U.S., Canada, and Hong Kong increased 236 bps, 186 bps and 211 bps, respectively. The S&P 500 decreased 19.4% and S&P/TSX decreased 8.7%. The 2021 losses were primarily due to the impact of interest rate increases partially offset by fair value gains in ALDA and higher equity markets. Fair value accounting policies affect the measurement of both our assets and our liabilities. Refer to “Impact of Fair Value Accounting” above. 42 | 2022AnnualReport | Management’sDiscussionandAnalysis
 2022 Annual Report Page 43 Page 45