
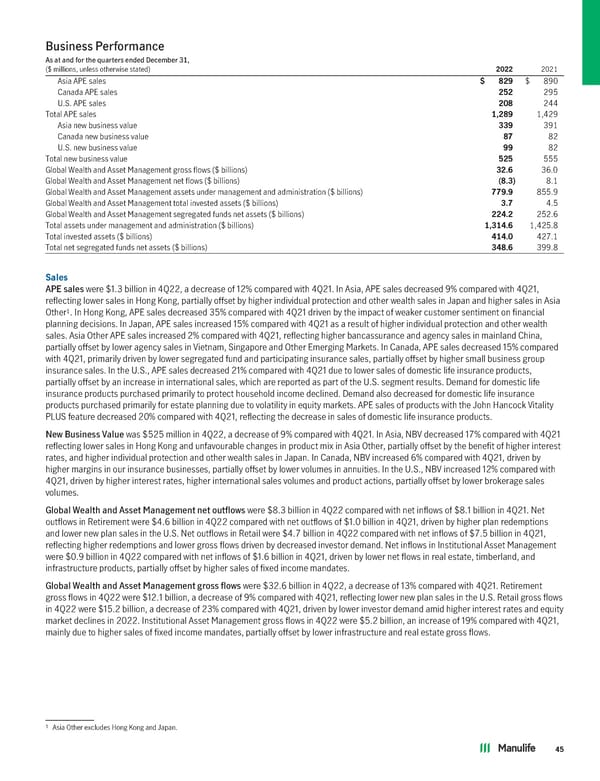
Business Performance As at and for the quarters ended December 31, ($ millions, unless otherwise stated) 2022 2021 Asia APE sales $ 829 $ 890 Canada APE sales 252 295 U.S. APE sales 208 244 Total APE sales 1,289 1,429 Asia new business value 339 391 Canada new business value 87 82 U.S. new business value 99 82 Total new business value 525 555 Global Wealth and Asset Management gross flows ($ billions) 32.6 36.0 Global Wealth and Asset Management net flows ($ billions) (8.3) 8.1 Global Wealth and Asset Management assets under management and administration ($ billions) 779.9 855.9 Global Wealth and Asset Management total invested assets ($ billions) 3.7 4.5 Global Wealth and Asset Management segregated funds net assets ($ billions) 224.2 252.6 Total assets under management and administration ($ billions) 1,314.6 1,425.8 Total invested assets ($ billions) 414.0 427.1 Total net segregated funds net assets ($ billions) 348.6 399.8 Sales APE sales were $1.3 billion in 4Q22, a decrease of 12% compared with 4Q21. In Asia, APE sales decreased 9% compared with 4Q21, reflecting lower sales in Hong Kong, partially offset by higher individual protection and other wealth sales in Japan and higher sales in Asia 1 Other . In Hong Kong, APE sales decreased 35% compared with 4Q21 driven by the impact of weaker customer sentiment on financial planning decisions. In Japan, APE sales increased 15% compared with 4Q21 as a result of higher individual protection and other wealth sales. Asia Other APE sales increased 2% compared with 4Q21, reflecting higher bancassurance and agency sales in mainland China, partially offset by lower agency sales in Vietnam, Singapore and Other Emerging Markets. In Canada, APE sales decreased 15% compared with 4Q21, primarily driven by lower segregated fund and participating insurance sales, partially offset by higher small business group insurance sales. In the U.S., APE sales decreased 21% compared with 4Q21 due to lower sales of domestic life insurance products, partially offset by an increase in international sales, which are reported as part of the U.S. segment results. Demand for domestic life insurance products purchased primarily to protect household income declined. Demand also decreased for domestic life insurance products purchased primarily for estate planning due to volatility in equity markets. APE sales of products with the John Hancock Vitality PLUS feature decreased 20% compared with 4Q21, reflecting the decrease in sales of domestic life insurance products. New Business Value was $525 million in 4Q22, a decrease of 9% compared with 4Q21. In Asia, NBV decreased 17% compared with 4Q21 reflecting lower sales in Hong Kong and unfavourable changes in product mix in Asia Other, partially offset by the benefit of higher interest rates, and higher individual protection and other wealth sales in Japan. In Canada, NBV increased 6% compared with 4Q21, driven by higher margins in our insurance businesses, partially offset by lower volumes in annuities. In the U.S., NBV increased 12% compared with 4Q21, driven by higher interest rates, higher international sales volumes and product actions, partially offset by lower brokerage sales volumes. Global Wealth and Asset Management net outflows were $8.3 billion in 4Q22 compared with net inflows of $8.1 billion in 4Q21. Net outflows in Retirement were $4.6 billion in 4Q22 compared with net outflows of $1.0 billion in 4Q21, driven by higher plan redemptions and lower new plan sales in the U.S. Net outflows in Retail were $4.7 billion in 4Q22 compared with net inflows of $7.5 billion in 4Q21, reflecting higher redemptions and lower gross flows driven by decreased investor demand. Net inflows in Institutional Asset Management were $0.9 billion in 4Q22 compared with net inflows of $1.6 billion in 4Q21, driven by lower net flows in real estate, timberland, and infrastructure products, partially offset by higher sales of fixed income mandates. Global Wealth and Asset Management gross flows were $32.6 billion in 4Q22, a decrease of 13% compared with 4Q21. Retirement gross flows in 4Q22 were $12.1 billion, a decrease of 9% compared with 4Q21, reflecting lower new plan sales in the U.S. Retail gross flows in 4Q22 were $15.2 billion, a decrease of 23% compared with 4Q21, driven by lower investor demand amid higher interest rates and equity market declines in 2022. Institutional Asset Management gross flows in 4Q22 were $5.2 billion, an increase of 19% compared with 4Q21, mainly due to higher sales of fixed income mandates, partially offset by lower infrastructure and real estate gross flows. 1 Asia Other excludes Hong Kong and Japan. 45
 2022 Annual Report Page 46 Page 48