
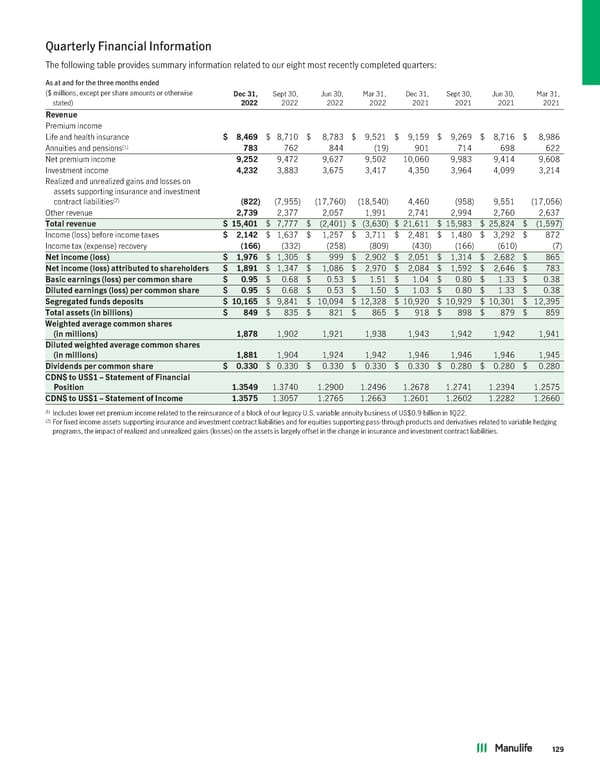
Quarterly Financial Information The following table provides summary information related to our eight most recently completed quarters: As at and for the three months ended ($ millions, except per share amounts or otherwise Dec31, Sept 30, Jun 30, Mar 31, Dec 31, Sept 30, Jun 30, Mar 31, stated) 2022 2022 2022 2022 2021 2021 2021 2021 Revenue Premium income Life and health insurance $ 8,469 $ 8,710 $ 8,783 $ 9,521 $ 9,159 $ 9,269 $ 8,716 $ 8,986 (1) Annuities and pensions 783 762 844 (19) 901 714 698 622 Net premium income 9,252 9,472 9,627 9,502 10,060 9,983 9,414 9,608 Investment income 4,232 3,883 3,675 3,417 4,350 3,964 4,099 3,214 Realized and unrealized gains and losses on assets supporting insurance and investment (2) contract liabilities (822) (7,955) (17,760) (18,540) 4,460 (958) 9,551 (17,056) Other revenue 2,739 2,377 2,057 1,991 2,741 2,994 2,760 2,637 Totalrevenue $ 15,401 $ 7,777 $ (2,401) $ (3,630) $ 21,611 $ 15,983 $ 25,824 $ (1,597) Income (loss) before income taxes $ 2,142 $ 1,637 $ 1,257 $ 3,711 $ 2,481 $ 1,480 $ 3,292 $ 872 Income tax (expense) recovery (166) (332) (258) (809) (430) (166) (610) (7) Netincome(loss) $ 1,976 $ 1,305 $ 999 $ 2,902 $ 2,051 $ 1,314 $ 2,682 $ 865 Netincome(loss)attributedtoshareholders $ 1,891 $ 1,347 $ 1,086 $ 2,970 $ 2,084 $ 1,592 $ 2,646 $ 783 Basicearnings(loss)percommonshare $ 0.95 $ 0.68 $ 0.53 $ 1.51 $ 1.04 $ 0.80 $ 1.33 $ 0.38 Dilutedearnings(loss)percommonshare $ 0.95 $ 0.68 $ 0.53 $ 1.50 $ 1.03 $ 0.80 $ 1.33 $ 0.38 Segregatedfundsdeposits $ 10,165 $ 9,841 $ 10,094 $ 12,328 $ 10,920 $ 10,929 $ 10,301 $ 12,395 Totalassets(inbillions) $ 849 $ 835 $ 821 $ 865 $ 918 $ 898 $ 879 $ 859 Weightedaveragecommonshares (in millions) 1,878 1,902 1,921 1,938 1,943 1,942 1,942 1,941 Dilutedweightedaveragecommonshares (in millions) 1,881 1,904 1,924 1,942 1,946 1,946 1,946 1,945 Dividendspercommonshare $ 0.330 $ 0.330 $ 0.330 $ 0.330 $ 0.330 $ 0.280 $ 0.280 $ 0.280 CDN$toUS$1–StatementofFinancial Position 1.3549 1.3740 1.2900 1.2496 1.2678 1.2741 1.2394 1.2575 CDN$toUS$1–StatementofIncome 1.3575 1.3057 1.2765 1.2663 1.2601 1.2602 1.2282 1.2660 (1) Includes lower net premium income related to the reinsurance of a block of our legacy U.S. variable annuity business of US$0.9 billion in 1Q22. (2) For fixed income assets supporting insurance and investment contract liabilities and for equities supporting pass-through products and derivatives related to variable hedging programs, the impact of realized and unrealized gains (losses) on the assets is largely offset in the change in insurance and investment contract liabilities. 129
 2022 Annual Report Page 130 Page 132