
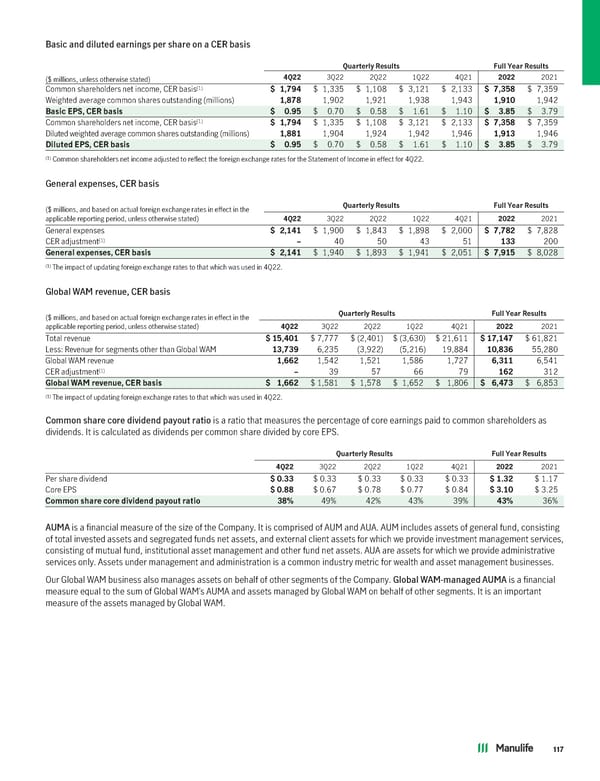
Basic and diluted earnings per share on a CER basis QuarterlyResults Full YearResults ($ millions, unless otherwise stated) 4Q22 3Q22 2Q22 1Q22 4Q21 2022 2021 (1) Common shareholders net income, CER basis $ 1,794 $ 1,335 $ 1,108 $ 3,121 $ 2,133 $ 7,358 $ 7,359 Weighted average common shares outstanding (millions) 1,878 1,902 1,921 1,938 1,943 1,910 1,942 BasicEPS,CERbasis $ 0.95 $ 0.70 $ 0.58 $ 1.61 $ 1.10 $ 3.85 $ 3.79 (1) Common shareholders net income, CER basis $ 1,794 $ 1,335 $ 1,108 $ 3,121 $ 2,133 $ 7,358 $ 7,359 Diluted weighted average common shares outstanding (millions) 1,881 1,904 1,924 1,942 1,946 1,913 1,946 DilutedEPS,CERbasis $ 0.95 $ 0.70 $ 0.58 $ 1.61 $ 1.10 $ 3.85 $ 3.79 (1) Common shareholders net income adjusted to reflect the foreign exchange rates for the Statement of Income in effect for 4Q22. General expenses, CER basis ($ millions, and based on actual foreign exchange rates in effect in the QuarterlyResults Full YearResults applicable reporting period, unless otherwise stated) 4Q22 3Q22 2Q22 1Q22 4Q21 2022 2021 General expenses $ 2,141 $ 1,900 $ 1,843 $ 1,898 $ 2,000 $ 7,782 $ 7,828 (1) CER adjustment – 40 50 43 51 133 200 Generalexpenses,CERbasis $ 2,141 $ 1,940 $ 1,893 $ 1,941 $ 2,051 $ 7,915 $ 8,028 (1) The impact of updating foreign exchange rates to that which was used in 4Q22. Global WAM revenue, CER basis ($ millions, and based on actual foreign exchange rates in effect in the QuarterlyResults Full YearResults applicable reporting period, unless otherwise stated) 4Q22 3Q22 2Q22 1Q22 4Q21 2022 2021 Total revenue $15,401 $ 7,777 $ (2,401) $ (3,630) $ 21,611 $17,147 $ 61,821 Less: Revenue for segments other than Global WAM 13,739 6,235 (3,922) (5,216) 19,884 10,836 55,280 Global WAM revenue 1,662 1,542 1,521 1,586 1,727 6,311 6,541 (1) CER adjustment – 39 57 66 79 162 312 GlobalWAMrevenue,CERbasis $ 1,662 $ 1,581 $ 1,578 $ 1,652 $ 1,806 $ 6,473 $ 6,853 (1) The impact of updating foreign exchange rates to that which was used in 4Q22. Common share core dividend payout ratio is a ratio that measures the percentage of core earnings paid to common shareholders as dividends. It is calculated as dividends per common share divided by core EPS. QuarterlyResults Full YearResults 4Q22 3Q22 2Q22 1Q22 4Q21 2022 2021 Per share dividend $0.33 $ 0.33 $ 0.33 $ 0.33 $ 0.33 $1.32 $ 1.17 Core EPS $0.88 $ 0.67 $ 0.78 $ 0.77 $ 0.84 $3.10 $ 3.25 Commonsharecoredividendpayoutratio 38% 49% 42% 43% 39% 43% 36% AUMA is a financial measure of the size of the Company. It is comprised of AUM and AUA. AUM includes assets of general fund, consisting of total invested assets and segregated funds net assets, and external client assets for which we provide investment management services, consisting of mutual fund, institutional asset management and other fund net assets. AUA are assets for which we provide administrative services only. Assets under management and administration is a common industry metric for wealth and asset management businesses. Our Global WAM business also manages assets on behalf of other segments of the Company. Global WAM-managed AUMA is a financial measure equal to the sum of Global WAM’s AUMA and assets managed by Global WAM on behalf of other segments. It is an important measure of the assets managed by Global WAM. 117
 2022 Annual Report Page 118 Page 120