
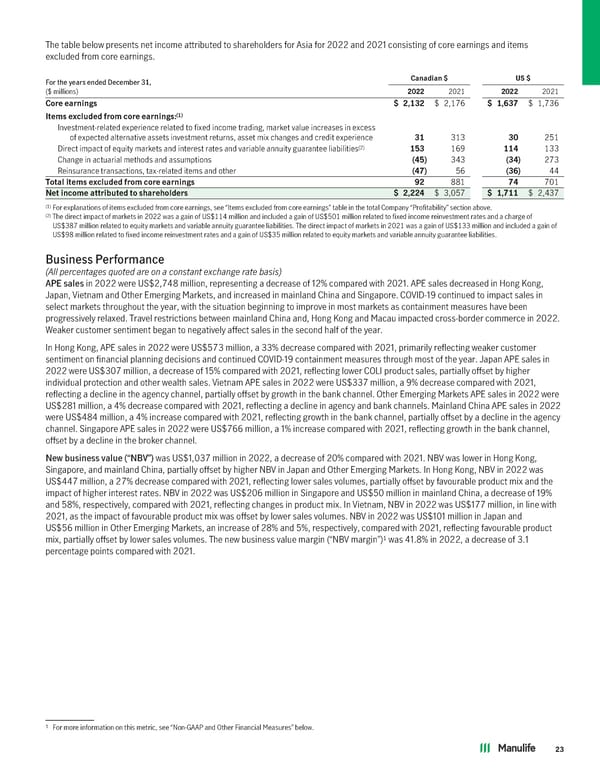
The table below presents net income attributed to shareholders for Asia for 2022 and 2021 consisting of core earnings and items excluded from core earnings. For the years ended December 31, Canadian$ US$ ($ millions) 2022 2021 2022 2021 Coreearnings $ 2,132 $ 2,176 $ 1,637 $ 1,736 (1) Itemsexcludedfromcoreearnings: Investment-related experience related to fixed income trading, market value increases in excess of expected alternative assets investment returns, asset mix changes and credit experience 31 313 30 251 (2) Direct impact of equity markets and interest rates and variable annuity guarantee liabilities 153 169 114 133 Change in actuarial methods and assumptions (45) 343 (34) 273 Reinsurance transactions, tax-related items and other (47) 56 (36) 44 Totalitemsexcludedfromcoreearnings 92 881 74 701 Netincomeattributedtoshareholders $ 2,224 $ 3,057 $ 1,711 $ 2,437 (1) For explanations of items excluded from core earnings, see “Items excluded from core earnings” table in the total Company “Profitability” section above. (2) The direct impact of markets in 2022 was a gain of US$114 million and included a gain of US$501 million related to fixed income reinvestment rates and a charge of US$387 million related to equity markets and variable annuity guarantee liabilities. The direct impact of markets in 2021 was a gain of US$133 million and included a gain of US$98 million related to fixed income reinvestment rates and a gain of US$35 million related to equity markets and variable annuity guarantee liabilities. Business Performance (All percentagesquotedareonaconstantexchangeratebasis) APE sales in 2022 were US$2,748 million, representing a decrease of 12% compared with 2021. APE sales decreased in Hong Kong, Japan, Vietnam and Other Emerging Markets, and increased in mainland China and Singapore. COVID-19 continued to impact sales in select markets throughout the year, with the situation beginning to improve in most markets as containment measures have been progressively relaxed. Travel restrictions between mainland China and, Hong Kong and Macau impacted cross-border commerce in 2022. Weaker customer sentiment began to negatively affect sales in the second half of the year. In Hong Kong, APE sales in 2022 were US$573 million, a 33% decrease compared with 2021, primarily reflecting weaker customer sentiment on financial planning decisions and continued COVID-19 containment measures through most of the year. Japan APE sales in 2022 were US$307 million, a decrease of 15% compared with 2021, reflecting lower COLI product sales, partially offset by higher individual protection and other wealth sales. Vietnam APE sales in 2022 were US$337 million, a 9% decrease compared with 2021, reflecting a decline in the agency channel, partially offset by growth in the bank channel. Other Emerging Markets APE sales in 2022 were US$281 million, a 4% decrease compared with 2021, reflecting a decline in agency and bank channels. Mainland China APE sales in 2022 were US$484 million, a 4% increase compared with 2021, reflecting growth in the bank channel, partially offset by a decline in the agency channel. Singapore APE sales in 2022 were US$766 million, a 1% increase compared with 2021, reflecting growth in the bank channel, offset by a decline in the broker channel. New business value (“NBV”) was US$1,037 million in 2022, a decrease of 20% compared with 2021. NBV was lower in Hong Kong, Singapore, and mainland China, partially offset by higher NBV in Japan and Other Emerging Markets. In Hong Kong, NBV in 2022 was US$447 million, a 27% decrease compared with 2021, reflecting lower sales volumes, partially offset by favourable product mix and the impact of higher interest rates. NBV in 2022 was US$206 million in Singapore and US$50 million in mainland China, a decrease of 19% and 58%, respectively, compared with 2021, reflecting changes in product mix. In Vietnam, NBV in 2022 was US$177 million, in line with 2021, as the impact of favourable product mix was offset by lower sales volumes. NBV in 2022 was US$101 million in Japan and US$56 million in Other Emerging Markets, an increase of 28% and 5%, respectively, compared with 2021, reflecting favourable product 1 was 41.8% in 2022, a decrease of 3.1 mix, partially offset by lower sales volumes. The new business value margin (“NBV margin”) percentage points compared with 2021. 1 For more information on this metric, see “Non-GAAP and Other Financial Measures” below. 23
 2022 Annual Report Page 24 Page 26